SEO attribution in 2026 is no longer a last-click game. If I want a usable view of organic search, I need to split observed data, modeled estimates, and incremental lift, then connect Search Console, analytics, and CRM data into one reporting setup.
Here’s the short version:
- Last-click organic is too narrow for long B2B sales cycles
- Source mapping comes before model choice
- Branded and nonbranded SEO need separate reporting
- Sourced, assisted, and influenced pipeline are not the same
- Cookie loss means I should report ranges, not one hard number
- SEO “touched revenue” is different from SEO “caused revenue”
In other words: if I’m reporting SEO to leadership in 2026, I need to show what I directly saw, what I estimated, and what I tested - and keep those lines separate.
What changed is simple. User journeys are harder to track across devices, browsers, consent states, and closed platforms. So the job is less about picking one “best” attribution model and more about building a clean measurement system that ties search demand to pipeline and closed-won revenue.
The article’s main point is clear: good SEO attribution starts with source taxonomy, not dashboard filters. From there, I can compare first-touch, last-touch, linear, time-decay, position-based, data-driven, mix-model, and lift-test reporting based on the business question I’m trying to answer.
A few points stand out:
- Search Console shows demand, not revenue
- Web analytics shows behavior, but only what it can still see
- CRM shows pipeline and revenue, but not the full path
- Assist reporting shows participation, not proof of cause
- Branded search lift can hint at demand growth, but other channels may be part of the change
I’d also keep one rule front and center: do not stack sourced pipeline and influenced pipeline as if they are separate dollars. A single $75,000 opportunity can appear in both views.
For most SEO teams, the best reporting setup now looks like this:
- Build a shared channel taxonomy
- Split branded vs. nonbranded organic
- Store first touch, last touch, and path history
- Join SEO touches to CRM opportunity data
- Label metrics as observed, modeled, or incremental
- Review data quality weekly, business results monthly, and test results quarterly
That gives me a reporting system I can explain without stretching the truth - and one leadership can use without confusing traffic, pipeline association, and causal impact.
Map traffic sources before choosing an attribution model
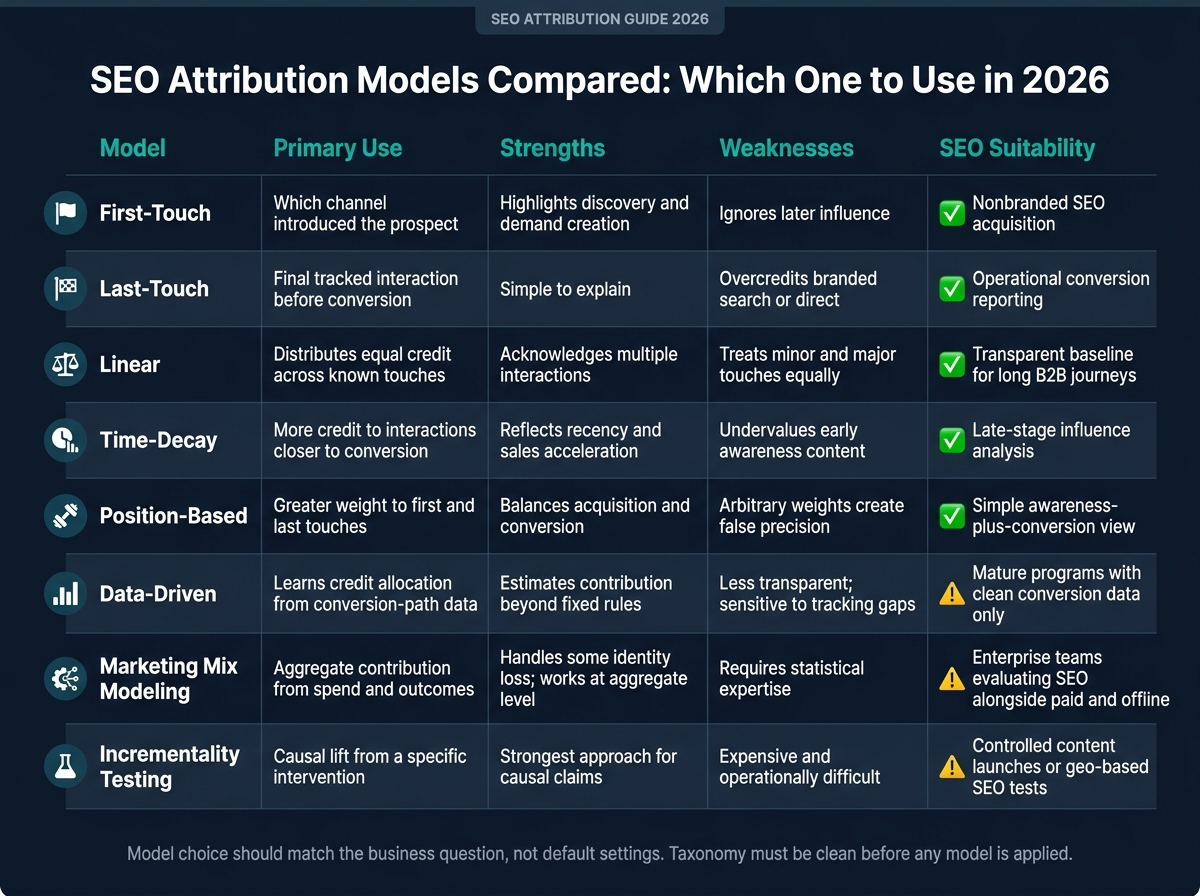
SEO Attribution Models Compared: Which One to Use in 2026
Clean attribution starts with a consistent source taxonomy. Set your own channel rules instead of leaning on default analytics groupings. If your source map isn’t shared across teams, cookie loss and browser limits can shove too many visits into direct or branded buckets.
At a minimum, your taxonomy should split out organic search - branded, organic search - nonbranded, paid search, direct, referral, email, social, AI-assisted discovery, and offline or self-reported touchpoints. Direct traffic is a fallback state, not proof of intent. It often comes from untagged links or lost referrers. AI-assisted discovery should be tracked on its own when you can identify it through referral domains, tagged links, analytics integrations, or CRM form responses. It should not be dumped into direct traffic by default.
Build a source taxonomy that matches real buyer discovery paths
Use standard naming rules: lowercase values, fixed spellings, and one approved value per field. Document approved values for source, medium, campaign, content, and term, along with who owns naming and approval. Normalized naming is the base for comparable attribution across Search Console, analytics, and CRM.
Your taxonomy should keep the raw values for auditing while adding normalized reporting fields. For example, google / organic might map to organic_search / nonbranded / informational, while the raw values stay available for review.
One simple channel hierarchy that keeps reporting clean:
| Level | Example |
|---|---|
| Channel | Organic search |
| Intent type | Branded or nonbranded |
| Source | Google, Bing |
| Medium | organic |
| Campaign / content | Content cluster or landing page |
Branded organic includes queries with your company name, product names, common misspellings, and brand-linked terms. Nonbranded organic includes everything else - category searches, problem-aware queries, and competitor comparisons. Google Search Console gives you this split directly, with impressions, clicks, average position, and CTR for each group. That said, the split is approximate because anonymized queries are left out when filtering by query, so the branded share is only an estimate.
Connect Search Console, web analytics, CRM, and first-party data
Search Console shows demand. Analytics shows behavior. CRM shows pipeline. On their own, none of them ties search demand to closed revenue.
At a minimum, the data model should keep:
- Event timestamp
- Anonymous or known identifier
- Source and medium
- Campaign
- Landing page
- Content asset
- Conversion event
- Consent state
- CRM status
- Account
- Opportunity
- Pipeline amount
- Revenue
It should also flag when a value is inferred or modeled instead of directly observed.
Identity gaps are real, and it’s better to show them plainly. A report that shows some organic form submissions tied to a CRM contact, some matched only at the account level, and some with no solid identity match is more believable than one that treats all organic pipeline as person-level, deterministic attribution. Label the gaps. Don’t hide them.
Compare attribution models for SEO reporting
Pick the model based on the decision you’re trying to make.
| Model | Primary use | Strengths | Weaknesses | SEO suitability |
|---|---|---|---|---|
| First-touch | Which channel introduced the prospect | Highlights discovery and demand creation | Ignores later influence | Useful for nonbranded SEO acquisition |
| Last-touch | Final tracked interaction before conversion | Simple to explain | Overcredits branded search or direct | Useful for operational conversion reporting |
| Linear | Distributes equal credit across known touches | Acknowledges multiple interactions | Treats minor and major touches equally | Useful as a transparent baseline for long B2B journeys |
| Time-decay | More credit to interactions closer to conversion | Reflects recency and sales acceleration | Undervalues early awareness content | Useful for late-stage influence analysis |
| Position-based | Greater weight to first and last touches | Balances acquisition and conversion | Arbitrary weights create false precision | Useful for a simple awareness-plus-conversion view |
| Data-driven | Learns credit allocation from conversion-path data | Estimates contribution beyond fixed rules | Less transparent; sensitive to tracking gaps | Useful for mature programs with sufficient clean conversion data |
| Marketing mix modeling | Aggregate contribution from spend and outcomes | Works at aggregate level; handles some identity loss | Requires statistical expertise | Useful for enterprise teams evaluating SEO alongside paid and offline |
| Incrementality testing | Causal lift from a specific intervention | Strongest approach for causal claims | Expensive and operationally difficult | Useful for controlled content launches or geo-based SEO tests |
That model choice only works if the source data is clean and mapped the same way every time.
Taxonomy is the data layer; attribution is the model applied to it. If you store only the last source, earlier SEO touches disappear, and branded organic ends up with too much credit.
Store original source, latest source, converting source, and full interaction history in a journey table. Never overwrite original source.
Once the source map is fixed, use it to measure how organic content shapes pipeline and assisted conversions.
Measure how organic content influences pipeline and assisted conversions
Once you’ve mapped traffic sources, the next job is to trace how organic touchpoints affect pipeline. Follow organic influence from impression to revenue, then connect Search Console, analytics, and CRM records to the same opportunity.
This matters because buyer journeys rarely move in a straight line. Someone might first find an SEO article, come back later through a different channel, and only convert after talking with sales. That first visit may get zero final-click credit, but it still helped move the deal along. That’s why sourced pipeline and influenced pipeline need separate fields.
Report sourced pipeline, influenced pipeline, and content-assisted opportunity rates
Track:
- organic-influenced pipeline
- organic-influenced revenue
- content-assisted opportunity rate
- median touches before opportunity creation
- time to opportunity
Use medians for touch counts and time-to-opportunity. A few large enterprise deals can skew averages in a big way.
| Pipeline type | Definition | Evidence required | Main interpretation risk |
|---|---|---|---|
| Sourced pipeline | Pipeline where the defined originating touch was an organic search visit or content conversion | CRM source fields, first-touch data, conversion timestamp, opportunity linkage, deduplicated opportunity ID | Multiple source fields or source changes can assign the same opportunity to different channels |
| Assisted pipeline | Pipeline where organic search or an SEO page appeared before the final converting interaction | Ordered interaction history, page or channel touch, conversion timestamp, opportunity linkage | The same opportunity can be assisted by several channels; assist values should not be added as one-off pipeline |
| Influenced pipeline | Pipeline where a qualifying organic content interaction occurred before opportunity creation | CRM opportunity ID, content-touch log, account/person identity resolution, influence-window rule | Broad windows can label incidental page visits as influence and can overlap with sourced and assisted pipeline |
| Incremental pipeline | Pipeline that would not have occurred without the SEO intervention | Randomized holdout, geo or audience experiment, or controlled pre/post design | Modeled lift can be overstated by seasonality, brand demand, sales activity, or other channels |
Do not add sourced and influenced pipeline together as if they were separate dollars. The same $75,000 opportunity can be both organic-sourced and organic-influenced. Report it once in sourced pipeline, once in influenced pipeline, and clearly disclose the overlap.
Use assisted conversion reporting without claiming full causation
An assisted conversion is a conversion path in which organic search or an SEO-influenced page appeared before the final converting interaction. That shows participation in the journey. It does not prove that SEO caused the outcome.
Track organic assist rate, assisted-to-last-touch ratio, average assists per opportunity, assisted conversion lag, and assisted opportunity rate by content cluster. Split branded and nonbranded assists because they answer different questions - validation versus discovery.
Be careful with the wording. Say that organic content appeared in 38% of measured opportunity paths, not that it generated 38% of opportunities. Also spell out your attribution window, identity-resolution coverage, consent limits, and whether the metric is based on sessions, people, or accounts.
These assisted metrics help connect content performance to branded search lift, where demand signals and conversion paths start to split.
sbb-itb-5be333f
Track branded search lift and report after cookie loss
After assisted conversions, branded search lift is one of the clearest ways to show whether SEO may be growing demand beyond tracked user paths.
If more people start searching for your company by name, that matters. It shows brand interest is up. But there's a catch: it doesn't tell you why that happened. The signal is there. The cause is still up for debate.
Validate branded search lift with multiple signals
Start with the branded vs. nonbranded split in Search Console. That gives you the first read. Then pressure-test it with other data sources.
Look at branded search next to direct sessions, returning-user rate, conversion rate, CRM opportunity timestamps, and publication dates. The story gets stronger when branded demand climbs after a clear content launch or ranking change, direct sessions and returning-user rate move up at the same time, and pipeline improves downstream - all without a paid campaign, PR push, or product launch happening in parallel.
If those other events did happen, log them in an annotation log. Be plain about what SEO may have influenced and what you can't pin on SEO alone.
For pre/post analysis, use a baseline of 8-12 weeks or the same period from the prior year. Then compare that against the post-publication window. Match weekday mix and seasonality so you're not comparing apples to oranges. Report:
- Absolute change
- Percentage change
- The confounders you found
Don't just drop in the lift number and move on.
The table below shows where branded search lift and incrementality sit in attribution after cookie loss:
| Method | Signal source | Interpretation | Main limitation | Validation method |
|---|---|---|---|---|
| Branded search lift | Search Console branded impressions and clicks, direct traffic, returning users, and brand-query trends | Brand demand or recognition increased during the measurement period | Cannot distinguish SEO from PR, paid media, social, product, or market effects | Pre/post analysis, matched periods, geographic comparisons, and confounder review |
| Incrementality | Holdout tests, randomized user tests, or geographic experiments | The additional conversions or pipeline caused by exposure to the intervention | Expensive, slower, and sensitive to contamination, sample size, and test design | Repeat tests, check pre-treatment trends, and report confidence intervals |
Separate observed, modeled, and incremental reporting after cookie loss
After third-party cookies and cross-site identifiers stopped giving full journey coverage, SEO contribution often has to be reported as a range, not one hard number. Consent-denied visits, browser restrictions, cross-device behavior, and disconnected platforms all create blind spots. No analytics platform can patch every gap by itself.
The practical move is simple: stop rolling everything into one blended attribution total. Label each metric for what it is, and keep those source definitions consistent across observed, modeled, and incremental reporting.
Observed metrics include directly linked sessions, conversions, opportunities, and revenue. Modeled metrics are estimates used to fill consent or identity gaps. For example, Google Analytics can apply behavioral modeling for users who decline analytics cookies by estimating their behavior from similar users who did consent. Incremental metrics come from controlled tests, such as geo holdouts or audience experiments. Aggregated metrics show channel-level movement when individual journeys can't be rebuilt.
Any report with modeled figures should spell out the coverage rate, attribution window, identity rules, and an uncertainty range. If you present modeled pipeline like it's exact, people will poke holes in it fast.
Use plain labels: observed organic revenue, modeled organic-associated revenue, and incremental lift estimate. These are not the same thing. Don't combine them without showing where overlap may exist. Keep those labels in place in the reporting cadence and ownership model that follows.
Build the SEO Attribution Operating Model for 2026
The operating model is what keeps attribution consistent across SEO, marketing, sales, finance, and leadership.
Document Definitions, Ownership, and Reporting Cadence
Once you've defined observed, modeled, and incremental metrics, lock in the rules behind them.
Create a one-page measurement contract with one shared set of definitions. It should spell out micro-conversions, qualified conversions, and revenue outcomes. It should also document pipeline stage entry and exit criteria, the finance-approved revenue field, attribution windows for first touch, last touch, assisted touch, and opportunity influence, rules for branded queries, direct-traffic treatment, consent requirements, and duplicate-data handling with canonical IDs for leads, contacts, accounts, opportunities, and revenue.
When teams report different "SEO-generated pipeline" totals, the issue is usually different definitions - not different data.
Assign ownership by function:
- SEO leadership - organic-source taxonomy, branded/non-branded rules, landing-page groupings, and search-visibility interpretation
- Marketing operations / RevOps - tracking architecture, campaign parameters, identity resolution, CRM joins, and data-quality monitoring
- Sales operations - opportunity-stage definitions, contact-role rules, opportunity-source fields, and pipeline reconciliation
- Finance - revenue fields and booking rules
- Privacy / legal - consent collection, retention, and acceptable use of first-party data
- Executive sponsor - dispute resolution and KPI hierarchy approval
Use three reporting cadences.
Weekly reviews should focus on data integrity. Check for missing UTMs, sudden direct-traffic changes, broken CRM joins, duplicate leads or opportunities, Search Console import failures, and consent-rate shifts.
Monthly reviews should compare organic sessions, non-branded clicks, qualified conversions, sourced pipeline, influenced pipeline, opportunity-assist rate, branded-search impressions, and closed-won revenue. Break those views out by content cluster, landing-page type, product, market, and funnel stage.
Quarterly reviews should validate the model against CRM outcomes, controlled SEO tests, geo comparisons, holdout groups, and page launches. This is also the time to review any changes to lookback windows, duplicate rules, or source taxonomy. Log decisions, anomalies, definition changes, and owners.
That cadence feeds the executive dashboard below.
Build an Executive Reporting Blueprint
The executive view should keep business association separate from causal evidence. In plain English, don't mix "SEO touched this deal" with "SEO caused this outcome." Use the contract to turn definitions into recurring reporting rules.
| Metric | Data source | Attribution status | Reporting frequency | Owner | Primary limitation |
|---|---|---|---|---|---|
| Organic search impressions and clicks | Search Console | Observed platform totals | Weekly and monthly | SEO | Does not show complete user journeys or CRM revenue |
| Non-branded clicks and impressions | Search Console query classification | Observed, with classification limits | Monthly | SEO | Anonymized and long-tail queries limit precision |
| Organic sessions and engaged visits | Web analytics | Observed or modeled where consent gaps exist | Weekly and monthly | Marketing operations | Browser, consent, and identity loss reduce coverage |
| Organic qualified conversions | Analytics and CRM | Observed when joined; otherwise modeled or unattributed | Weekly and monthly | RevOps | Form, consent, and duplicate-record issues |
| Sourced pipeline | CRM plus source-of-record rules | Direct attribution under the defined rule | Monthly | RevOps and sales operations | Source fields may be incomplete or overwritten |
| Influenced pipeline | CRM plus qualifying organic interactions | Assisted/influenced, not causal by default | Monthly and quarterly | RevOps and SEO | Presence of an SEO touch does not prove incremental impact |
| Content-assisted opportunity rate | CRM, analytics, and content interaction table | Assisted | Monthly | Content and RevOps | Varies with interaction and lookback definitions |
| Branded-search lift | Search Console plus analytics, media, and experiment data | Observed or incremental if tested | Monthly and quarterly | SEO and marketing analytics | Other campaigns can create brand demand |
| Closed-won revenue associated with organic | CRM and finance system | Revenue-linked attribution | Monthly and quarterly | Finance and RevOps | Revenue timing, renewals, and account ownership complicate attribution |
| Incremental SEO impact | Experiment, holdout, or geo-test data | Incremental | Quarterly or after test completion | Marketing analytics | Tests may lack power or isolate only one initiative |
| Data-quality coverage | Warehouse, analytics, CRM, and consent logs | Control metric | Weekly | Marketing operations | A high coverage rate does not guarantee correct classification |
Report traffic, pipeline, revenue, and confidence level as separate lines. Don't blend them into one attribution score. That kind of roll-up may look neat on a dashboard, but it hides the difference between observed activity, revenue association, and causal proof.
FAQs
How should SEO teams handle attribution when data is incomplete?
When data is incomplete, SEO teams need one shared view of performance. The simplest way to get there is to connect website analytics with CRM data. That gives you a cleaner picture of how organic search supports leads, pipeline, and revenue - not just clicks and sessions.
As third-party cookies fade, setup matters more. Use server-side tracking and standardized UTM parameters to cut down on misclassified traffic and keep source data more consistent.
It also helps to audit your data on a regular basis. Remove duplicates, standardize naming, and flag tracking issues before they skew reporting. Then use multi-touch attribution so organic search gets credit for assisted conversions across the full customer journey.
What’s the difference between sourced, assisted, and influenced pipeline?
- Sourced pipeline: deals where a channel - such as organic search - gets credit for starting the lead or opportunity.
- Assisted conversions: touchpoints that supported the journey but were not the last interaction before conversion.
- Influenced pipeline: the total deal value where a channel or asset showed up at any point before the sale closed.
How can I prove SEO caused revenue, not just touched it?
Move past last-click attribution. Tie your analytics platform and CRM together so you can track the full path - from the first organic session all the way to a closed deal.
Then use multi-touch attribution, incrementality testing, and revenue-based KPIs like CLV and pipeline contribution to show SEO’s direct impact over time, not just the last step before conversion.