Social media audience insights are critical for creating content that connects with your followers. By analyzing demographics, behaviors, and interests, you can move beyond basic metrics like clicks and views to understand why your audience engages. This guide covers:
- The rise of zero-party data as privacy regulations tighten.
- Key metrics like demographics, engagement, and behavioral patterns.
- Tools like Facebook Insights, Instagram Insights, and LinkedIn Analytics to gather actionable data.
- Steps to analyze data, track trends, and improve your strategy.
- Recommended tools such as SparkToro and Delve AI for advanced audience research.
Key Takeaways:
- 73% of marketers say audience data drives success.
- 76% of consumers feel frustrated when brands fail to personalize.
- Platforms like Instagram and TikTok have distinct user behaviors and engagement patterns.
Social Media Insights 101
sbb-itb-5be333f
Key Metrics for Understanding Your Social Media Audience
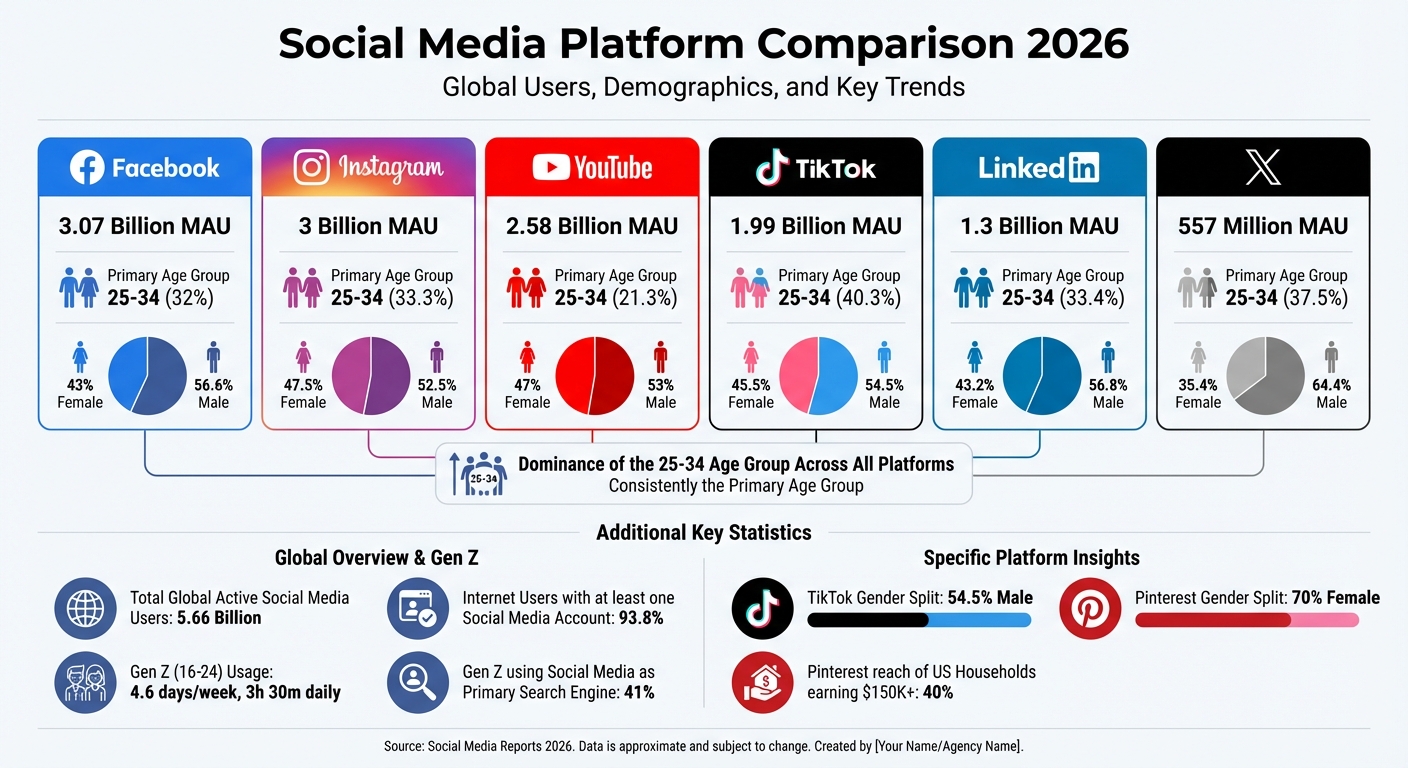
Social Media Platform Demographics and User Statistics 2026
Tracking the right metrics transforms guesswork into actionable strategies. With 5.66 billion active social media users globally and 93.8% of internet users having at least one social media account, the amount of data available is staggering. The challenge lies in identifying the metrics that truly matter. Dan Zarrella, Social Media Scientist at HubSpot, sums it up perfectly:
"Just as driving blindfolded would lead to accidents, marketing without data can lead to poor decisions and wasted resources."
By focusing on demographics, engagement, and behavior, you can build a complete picture of your audience. These insights help you create content that connects and performs.
Demographics: Who Is Your Audience?
Demographics tell you who you're reaching. Age, for example, plays a huge role in how people consume content. A 22-year-old Gen Z user interacts with social media differently than a 45-year-old Gen X professional. Gen Z users, ages 16–24, spend about 4.6 days a week on social media, averaging 3 hours and 30 minutes daily. Interestingly, 41% of Gen Z now use social media as their primary search engine, overtaking Google.
Gender also shapes strategy. On TikTok, 54.5% of users are male, while Pinterest's audience is 70% female. These differences influence everything from influencer partnerships to visual design choices. Geographic location matters, too. A brand targeting audiences in New York and Los Angeles must consider the three-hour time difference and adjust posting times and references accordingly.
Income levels offer another layer of insight. Pinterest, for instance, reaches 40% of U.S. households earning over $150,000 annually. For B2B marketers, LinkedIn provides occupation and industry data, making it easier to identify decision-makers. Even device preferences matter - mobile users lean toward vertical videos, while desktop users are more accustomed to horizontal formats.
| Platform | Monthly Active Users | Primary Age Group | Gender Distribution (Global) |
|---|---|---|---|
| 3.07 Billion | 25-34 (32%) | 43% Female / 56.6% Male | |
| 3 Billion | 25-34 (33.3%) | 47.5% Female / 52.5% Male | |
| TikTok | 1.99 Billion | 25-34 (40.3%) | 45.5% Female / 54.5% Male |
| YouTube | 2.58 Billion | 25-34 (21.3%) | 47% Female / 53% Male |
| X (Twitter) | 557 Million | 25-34 (37.5%) | 35.4% Female / 64.4% Male |
| 1.3 Billion | 25-34 (33.4%) | 43.2% Female / 56.8% Male |
Once you understand who your audience is, the next step is figuring out what content gets their attention.
Engagement Metrics: What Resonates with Your Audience?
Engagement metrics are a direct reflection of how your audience feels about your content. In fact, 89% of marketers use engagement as their go-to success metric. Likes and reactions give a quick read on approval, while comments indicate deeper interaction. For example, Facebook posts with high comment engagement get 5x more visibility than those with just likes. As Trish Riswick, Social Media Manager at Hootsuite, puts it:
"Comments reveal post effectiveness and stronger connections."
Shares are another powerful indicator. They show your content resonates enough for people to spread it. Research shows 44% of people share content they agree with, 29% because it’s informative, and 24% because it’s inspiring. Saves, on the other hand, highlight long-term value - users bookmark content they want to revisit later.
Video completion rates are particularly revealing. They show whether your content holds attention all the way through, distinguishing between initial interest and sustained engagement.
But engagement is only part of the picture. To truly connect, you need to understand when and how your audience interacts.
Behavioral Insights: When and How Your Audience Interacts
Behavioral patterns help you identify the best times and ways to reach your audience. Posting during peak activity ensures your content doesn’t get lost in the shuffle. On average, users engage with 6.75 different social platforms each month, so timing strategies should be tailored to each platform. For instance, brands on X/Twitter post more than 10 times a week to stay visible, while TikTok averages 15 posts per month and Instagram around 20.
Striking the right balance is key. Posting too little makes you invisible, while overposting risks annoying your audience. Experiment with different posting frequencies and monitor how engagement metrics like likes, shares, and clicks respond. Paula Perez, Social Content Specialist at Oatly, highlights the importance of staying timely:
"The community now expects us to be part of the moment. When we're late to a conversation, people call it out."
Fast-paced platforms like X/Twitter require daily tracking, while slower-moving platforms like TikTok benefit from weekly or monthly reviews. Don’t just track when people interact - pay attention to how. Are they watching Stories, clicking links, or saving posts? Combine this with the fact that 60% of people are willing to share their data for personalized experiences, and you’ll see the value of interactive content like polls and quizzes. These insights not only measure performance but also inform smarter, more targeted content strategies.
Top Analytics Tools for Social Media Audience Insights
Most major social platforms come with built-in analytics tools, allowing you to gain a deeper understanding of your audience without relying on third-party SEO marketing tools. These tools transform raw data into actionable insights, which are crucial for planning content effectively.
Facebook Insights
Facebook Insights is a free feature available to all Facebook Pages and professional profiles, though you'll need at least 100 followers to get accurate data. This tool lets you compare your followers' demographics to the broader Facebook audience, offering insights into age, gender, and other key traits. It also tracks interests and affinities, showing the categories of Pages your audience engages with most and how likely they are to interact with specific Pages compared to the average user. Meta for Business explains:
"Facebook Audience Insights gives you aggregated information about two groups of people – people connected to your Page and people on Facebook – so you can create content that resonates and easily find more people like the ones in your current audience."
The tool monitors audience behavior over a 30-day span, capturing data on comments, likes, shares, and ad clicks. For example, one study found users clicked an average of 35 ads within a month. It also provides details on technology usage, such as whether your audience prefers desktop or mobile devices, and tracks purchase behaviors, identifying heavy buyers and their shopping habits. By checking the "Activity" tab, you can determine your audience's preferred device, while the "Page Likes" section reveals other brands and influencers they follow. Additionally, the Insights tab in Meta Business Suite highlights when your followers are most active, helping you time your posts for maximum reach.
Instagram Insights, on the other hand, focuses on metrics tailored to visual and short-lived content.
Instagram Insights
Instagram Insights is accessible to Business and Creator accounts, with demographic data available once you hit 100 followers. It breaks down your audience by age, gender, top cities, countries, and even primary languages. Beyond basic stats, Instagram emphasizes meaningful engagement by tracking "Saves" and "Shares", which indicate content that resonates long-term. As Liam Derbyshire, CEO of Influize, puts it:
"If people are saving your posts, it means the content has long-term value in their eyes."
Instagram also reveals when your followers are most active, making it easier to schedule posts for peak engagement. For Stories, you can access metrics like forward/backward taps, exits, replies, and sticker interactions. Reels provide average watch time data, which is a key factor in how the algorithm ranks your content. While some metrics cover up to two years, others, like Stories data, are limited to the last 30 to 90 days. To measure engagement, use this formula: (Total Engagements ÷ Reach) × 100. The "Follows from posts" metric can help identify which content drives audience growth. Additionally, monitoring "Exits" and "Swipes away" in Stories gives you clues about where your audience loses interest.
For a more professional focus, LinkedIn Analytics offers insights tailored to B2B strategies.
LinkedIn Analytics
LinkedIn Analytics is designed for professional data, offering details about job titles, seniority levels, industries, and company sizes. It helps you identify decision-makers within your target audience and provides skill-based insights to refine your content for specific professional groups. Features like "Who Viewed Your Profile" and "Search Appearances" reveal the professional backgrounds of those interacting with your content. You can also track "Profile viewers from this post" and "Followers gained from this post", directly linking your content's success to networking growth.
For post viewers, LinkedIn breaks down demographics by job title, location, company, industry, and seniority. Video analytics even show viewers' workplaces and job roles. Use the "Top Demographics" toggle in Audience Analytics to ensure your followers align with your ideal customer profile across categories like industry, company size, and seniority. The "Search Appearances" metric provides insight into the keywords and roles of people discovering your profile. While LinkedIn's basic analytics are free, Premium accounts offer expanded features, such as a list of up to 100 recent profile viewers. Keep in mind, demographic data is only shown when there are enough unique viewers to protect anonymity.
How to Gather and Analyze Social Media Audience Insights
To shape a strong content strategy, start by collecting and analyzing demographic and behavioral data. This involves three main steps: gathering relevant data, evaluating content performance, and identifying trends to guide your future decisions.
Collect Demographic and Behavioral Data
Focus on actionable insights by setting SMART goals, avoiding distractions like vanity metrics (e.g., follower counts). Select platforms based on where your audience is most active - LinkedIn for B2B professionals or TikTok for Gen Z, for instance.
Use a 4-dimensional analysis model to dig deeper into your audience. This includes:
- Demographics: Who they are.
- Psychographics: Why they care.
- Behaviors: How they interact.
- Needs: What they’re missing.
Tools like Instagram Insights and platforms like Semrush can help consolidate data across channels while offering competitor benchmarks. Add social listening to capture qualitative insights that numbers alone might miss.
Timing matters - schedule demographic reports two days after the month ends to ensure platforms have processed all interactions. Segment your audience into buyer personas based on shared traits, and regularly validate this data through audits (monthly or annually) to track shifts and spot anomalies.
Analyze Content Performance
Dive into your posts to uncover which themes and formats consistently hit the mark - or miss. Group posts by topic (e.g., educational, behind-the-scenes, memes) to identify patterns in audience preferences.
For video content, focus on metrics like average view duration and completion rates - these give a clearer picture of engagement than raw view counts. If your video views are high but watch times are low, consider tweaking the opening seconds for a stronger hook. Also, keep in mind that 82% of social media videos are watched without sound, so adding subtitles is crucial.
Integrate your social data with Google Analytics 4 (GA4) and CRM tools to see how social interactions lead to website conversions and purchases. Assign monetary values to actions like clicks, comments, and shares to calculate the ROI of organic versus paid efforts.
Once you’ve identified performance trends, you can move on to mapping broader engagement patterns.
Map Engagement Patterns and Trends
Use time-series analysis to spot trends and determine peak activity hours, allowing you to optimize your posting schedule for better reach.
Apply clustering analysis to group audience members with similar behaviors and traits, helping you uncover niche segments. Organize posts by themes, campaigns, or product launches with content tagging and query building, so you can track performance across platforms more precisely. Lastly, leverage regression analysis to see how specific demographics influence engagement rates, helping you identify which segments drive the most meaningful interactions.
These techniques don’t just assess past performance - they lay the groundwork for smarter, data-driven strategies moving forward.
Turning Audience Insights Into Content Strategies
Your audience metrics can do more than just inform - you can turn them into a focused content strategy. Start by identifying 3–5 key content pillars that reflect both your brand's identity and what your audience cares about. Instead of leaning solely on demographics, use psychographic data like values, interests, and challenges to shape these pillars. For example, Patagonia tapped into their audience's passion for environmental activism through psychographic analysis. This insight led them to highlight sustainability efforts on social media rather than just promoting products.
Choose content formats that match where and how your audience engages. Whether it’s short TikTok videos, in-depth LinkedIn articles, or visually engaging Instagram carousels, tailoring content to platform preferences is essential. Follow the 70/20/10 rule: dedicate 70% of your content to educational or entertaining posts, 20% to curated content, and 10% to direct promotions. Research shows that educational and entertaining posts generate 66% more engagement than purely promotional ones.
Each platform has its own vibe, so adapt accordingly. LinkedIn thrives on professional insights, while TikTok rewards genuine, unscripted moments. The Atlanta Hawks, for instance, found that casual, behind-the-scenes videos consistently outperformed polished productions, proving that authenticity often resonates more than perfection.
"A mistake I see brands making is only going by the playbooks of what they're seeing well with other brands. Having a purpose on social media and knowing that purpose is so important in the content creation process." - Caity Barnes, Freelance Social Media Strategist
Social listening is another powerful tool for spotting content opportunities. Oatly, for example, noticed a growing demand for matcha-flavored beverages in regions like DACH, Spain, and France. This insight led them to introduce a matcha oat drink in the EU. Map your content to different stages of the customer journey - awareness, consideration, and decision - ensuring each piece nudges followers closer to a conversion. And don’t forget to fine-tune your approach through A/B testing - experiment with headlines, visuals, and calls-to-action to see what works best.
Recommended Tools from Top SEO Marketing Directory for Audience Research
When it comes to understanding your audience on a deeper level, tools curated by the Top SEO Marketing Directory can make all the difference. These tools go beyond surface-level data, diving into psychographics and cross-platform behaviors to uncover why your audience engages, not just who they are.
Featured Tools for Advanced Audience Insights
SparkToro is a standout tool for identifying the podcasts, YouTube channels, and social accounts your audience follows. This makes it easier to find niche influencers with highly engaged followers. As Vinny La Barbera, Founder & CEO of imFORZA, puts it:
"SparkToro is the best marketing tool for startups. A startup can't and shouldn't spend time on marketing until they know who their audience is."
Delve AI takes things further with its "Digital Twin" technology, which creates synthetic customer segments. This feature allows you to test messaging and refine strategies before launch, making content planning more precise. Trusted by over 41,000 brands and agencies, Delve AI has delivered tangible results - like helping Orientbell Tiles achieve a 50% boost in CTR and a 10% increase in VTR during their Women's Day campaigns in 2026.
Semrush Audience Intelligence integrates IBM Watson’s analysis of the "Big 5" personality traits - openness, conscientiousness, extraversion, agreeableness, and neuroticism. This tool helps you align your tone and messaging with your audience's psychological profile. For agencies managing multiple clients, Audiense (Insights) offers large-scale audience segmentation, analyzing up to 250,000 audience members per report and providing cultural insights.
Comparison Table of Plans and Features
| Plan Tier | Representative Tool | Key Features | Starting Price | Best For |
|---|---|---|---|---|
| Basic | SparkToro Personal | 5–100 searches/month, demographic data, keyword discovery, Reddit/YouTube analysis | $38–$50/month | Freelancers and small businesses |
| Premium | Delve AI Business | AI persona generation, Digital Twin chat, 1 brand tracking, monthly updates | $199/month | Growing marketing teams seeking automated insights |
| Enterprise | Audiense (Insights) | Cultural insights, 5+ reports/month, advanced segmentation, white-label reporting | $1,499/month | Large agencies managing multiple client brands |
These tools, categorized into basic, premium, and enterprise tiers, make it easier to match your needs with your budget. Whether you're a freelancer or running a large agency, the Top SEO Marketing Directory has options tailored to your goals.
Conclusion
Social media audience insights have shifted from being optional to a core part of modern business strategies. With 73% of marketers emphasizing the importance of audience data in their planning, the brands that succeed in 2026 will be the ones that truly understand why their audience behaves the way they do. The distinction between raw data and meaningful insights is what turns overlooked content into content that truly connects with people.
To get started, focus on asking the right questions to guide your data analysis. As the team at Xpoz wisely states:
"The goal isn't perfect measurement - it's better decisions."
Whether you're an independent freelancer or part of a large enterprise, the strategies outlined here can help transform raw numbers into compelling stories. These insights allow you to fine-tune every aspect of your content strategy. Personalized engagement will still be essential, and human-created content will remain a top priority in 2026. These elements shape everything from your content calendar to your product development process.
The future also leans heavily on privacy-first data collection, AI-driven predictive models, and targeting niche communities. With the average cost of a data breach hitting $4.45 million in 2025, staying compliant with data regulations isn't just ethical - it's a financial safeguard. Using methods like zero-party data collection and progressive profiling helps you earn trust while gathering the insights needed to stay ahead.
For easy access to advanced tools, the Top SEO Marketing Directory offers a curated selection of resources to simplify the process. Whether you're starting with a free plan or upgrading to enhanced features for $49/month, with enterprise options available, this directory connects you with tools tailored to your audience's needs. In 2026, actionable audience insights will be the foundation of every winning content strategy.
FAQs
What’s the difference between zero-party, first-party, and third-party data?
Zero-party data refers to information that customers voluntarily provide, such as through survey responses or preference settings. This type of data is clear and dependable because it comes directly from the customer.
First-party data, on the other hand, is gathered directly by businesses through customer interactions - think website activity, purchase history, or app usage. It’s highly accurate and relevant since it’s based on direct engagement.
Third-party data, however, is collected from external sources across various platforms. While it can provide broader insights, it’s often less transparent and reliable. Plus, growing privacy regulations are making it harder for businesses to access and use this type of data.
What are the first 3 audience metrics I should track for my brand?
Understanding audience engagement, demographics, and reach is crucial when evaluating your social media performance. Here's why:
- Engagement reflects how your audience interacts with your content - likes, comments, shares, and clicks. It shows what resonates and sparks interest.
- Demographics provide insight into who your audience is, including factors like age, gender, and location. This helps you create content that speaks directly to them.
- Reach measures the number of people who see your posts, giving you an idea of your content's visibility and potential impact.
These metrics form the backbone of any effective social media strategy, offering clear guidance on what to adjust and where to focus your efforts.
How do I turn audience insights into a weekly content plan?
To build a weekly content plan that truly connects with your audience, start by digging into the data about your followers. Look at details like their demographics, interests, and behaviors. This information will help you pinpoint the topics, formats, and messaging that click with them the most.
Once you have this insight, map out a content calendar that aligns with their preferences. Stick to a consistent posting schedule to keep your audience engaged. As you go, pay attention to real-time engagement data - this will guide you in tweaking themes and approaches to stay relevant.
Don’t forget to regularly monitor performance metrics. This step is key to fine-tuning your strategy and ensuring your content continues to resonate with your audience.