Most SEO reports miss the point: leaders want business results, not a list of tasks. If I’m building a monthly B2B SEO report, I focus on three things first - non-brand visibility, how B2B SEO drives lead generation, and pipeline impact.
Here’s the short version:
- I compare the last 28 days vs. the prior 28 days
- I also compare the last 3 months vs. the same period last year
- I separate branded vs. non-brand traffic
- I lead with qualified leads, influenced pipeline, and closed-won revenue
- I use rankings, CTR, landing page shifts, content changes, and technical issues to explain why numbers moved
A good report should answer simple questions fast:
- Did organic traffic from non-brand search go up or down?
- Did that traffic turn into demos, trials, or sales-ready leads?
- Did SEO help create or assist pipeline?
- What changed this month?
- What should the team do next?
I’d also keep the report short and direct. For example, if traffic fell 8% month over month but was up 23% year over year, that changes the story. If impressions rose but clicks did not, I’d check for AI Overviews, since they can cut click-through rate even when rankings hold.
The checklist itself comes down to a few core parts:
- Executive summary - month, main shift, business result, next action
- Search performance - priority keyword movement, clicks, impressions, CTR, and landing page changes
- Conversion data - demo requests, trial sign-ups, MQLs, SQLs, and conversion rate by page type
- Pipeline view - SEO-sourced deals, SEO-assisted deals, influenced pipeline, and revenue
- Content and technical notes - pages shipped, pages updated, indexation, Core Web Vitals, and tracking issues
For B2B teams, one more point matters: non-brand metrics should lead the report. Branded traffic can grow because of paid media, PR, or direct demand. Non-brand traffic shows whether SEO is driving net-new discovery.
If I were sending this to a CMO, VP, or CFO, I’d keep the main takeaway to a few lines: what moved, what caused it, what it meant for pipeline, and what support is needed next month.
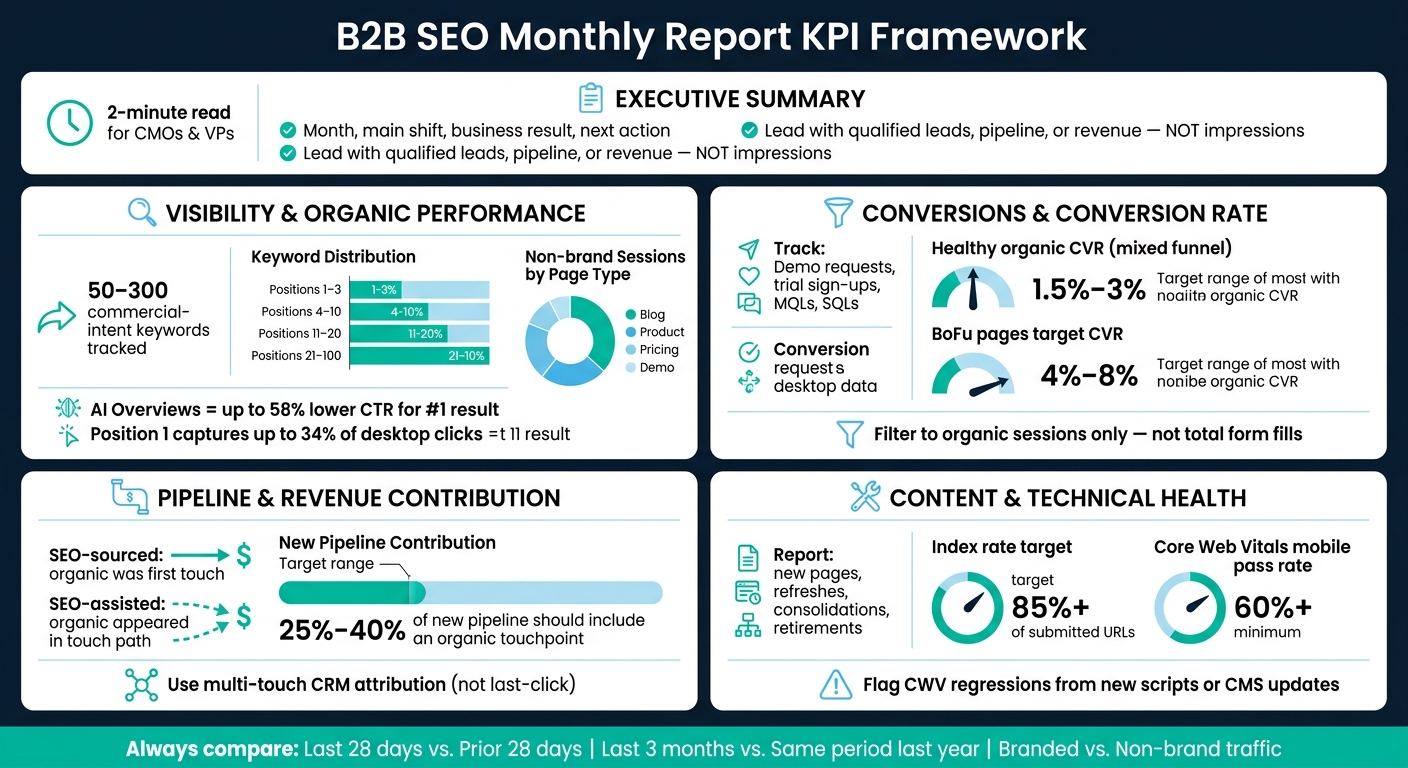
B2B SEO Monthly Report KPI Framework
How to Build SEO Reports That Clients Understand (And Actually Read)
sbb-itb-5be333f
Executive Summary
Start with a 2-minute read for CMOs and VPs of Demand Gen. Name the reporting month, the main shift, why it mattered, and what needs to happen next.
Monthly performance snapshot
Open with business results - qualified organic leads, pipeline, or revenue - not impressions or total keyword counts. Sum up the month in 3 to 4 sentences. Focus on qualified leads from organic, what caused the change, and the next step.
Use the bullets below to show the exact metrics behind that summary:
- Qualified conversions from organic - demo requests, form fills, or trial signups, plus the month-over-month change
- Organic traffic and non-brand sessions - total non-brand sessions and landing page movement
- Key win - the ranking gain, content cluster, GEO visibility lift, or technical fix that drove the result
- Key concern - a ranking drop on a pricing or demo page, a CTR decline despite steady impressions, or an indexation problem that needs attention
If impressions go up but clicks don't move, call out AI Overviews. They can reduce position-one CTR on informational terms. Also include visibility in AI-generated answers alongside Google rankings.
Decision notes for leaders
Write this part for a CFO or CEO: what to scale, what to fix, and what decision is needed next month - budget, IT support, or editorial time.
Keep decision notes to 3 to 4 lines max. Use the sections below to unpack the rankings, traffic, conversions, and technical factors behind the summary.
The next section breaks out the search visibility and traffic changes behind these headlines.
Visibility and Organic Performance
Use this section to show which queries and pages moved, and whether those moves reached buyers. The point is simple: can buyers find you for the searches they use, and is that visibility sending qualified traffic to pages that can convert?
Rankings for priority non-brand terms
Track a curated set of 50-300 commercial-intent keywords tied straight to product, pricing, comparison, and integration pages. These pages usually have the shortest path to pipeline.
Skip the single “average position” headline number. It hides too much. Instead, report keyword distribution across four bands:
- Positions 1-3
- Positions 4-10
- Positions 11-20
- Positions 21-100
This gives leadership a much clearer read on movement. Keywords in positions 11-20 are often the easiest wins. They’re close enough that a few focused page updates can push them onto page one. And that matters, because position 1 can capture up to 34% of desktop clicks.
Filter out branded queries before you report anything. Non-brand rankings show actual SEO-led discovery, not demand your brand already picked up through other channels.
Then check whether those ranking moves show up in Search Console clicks and landing-page traffic.
Clicks, impressions, CTR, and average position
Pull this data from Google Search Console, filtered to non-brand queries. Compare the last 28 days vs. the prior 28 days vs. the same 28 days last year. MoM helps you spot recent swings. YoY helps control for seasonality, which matters in B2B buying cycles.
| Metric | MoM Use | YoY Use |
|---|---|---|
| Clicks | Spots impact of recent content or technical changes | Accounts for seasonal demand shifts |
| Impressions | Detects sudden visibility gains from new indexation | Shows long-term topical authority growth |
| CTR | Flags SERP features or weak snippets | Reveals long-term shifts in brand preference or SERP layout changes |
| Avg. Position | Monitors volatility after specific optimizations | Tracks long-term ranking position |
If impressions go up but clicks don’t, say why. One common reason: AI Overviews correlate with a 58% lower CTR for the #1 organic result. When that pattern shows up, revisit title tags and meta descriptions so they line up better with search intent.
Use these signals to explain which pages picked up demand and which ones lost it.
Non-brand sessions and landing page shifts
Once you’ve covered query-level visibility, check whether non-brand traffic actually reached the pages that matter.
Non-brand organic sessions are the clearest signal of incremental organic demand. Exclude brand terms and common misspellings in Google Search Console before you pull session data.
Break sessions out by page type - blog, product, solution, pricing, demo - instead of giving one site-wide total. Also track a fixed group of 5-20 high-intent commercial pages each month, with extra attention on product, pricing, comparison, and demo pages. For each URL, note whether traffic grew, held, or declined.
Call out what drove any material change. That might be new content, technical updates, or an algorithm update. You can also consult top SEO tools and marketing resources to identify which external factors might be influencing your performance. If non-brand sessions stay flat for several months while total organic traffic rises, that growth is almost certainly branded. In plain English: SEO spend is not driving net-new discovery.
Conversions and Pipeline Contribution
After visibility, the next step is simple: did organic traffic convert? Traffic tells you how much volume you have. Conversions tell you whether that traffic was worth getting.
Qualified conversions and conversion rate
Track demo requests, trial sign-ups, pipeline-qualified form fills, and MQLs/SQLs from organic sessions - not total form submissions.
For conversion rate, put the spotlight on BoFu pages like pricing, comparison, and integration pages. On a B2B SaaS site with mixed-funnel content, a healthy organic conversion rate usually falls between 1.5% and 3%. BoFu pages should land closer to 4% to 8%.
If a pricing page is converting at 0.8%, call that out. Then get specific about the likely reason:
- the page itself is weak
- the traffic mix shifted
- tracking is off
If conversion rate drops month over month, say what probably caused it. Maybe a landing page changed. Maybe traffic leaned more toward top-of-funnel visits. Maybe tracking broke. Leadership shouldn't have to piece that together on their own.
Assisted deals and SEO-influenced pipeline
Once you know conversion volume, connect those conversions to pipeline and revenue.
B2B deals often take 60 to 90 days to close, which means organic search may influence a deal long before the last click. Last-click attribution misses that. Multi-touch attribution in your CRM fills in the gap.
Split SEO-sourced outcomes from SEO-assisted outcomes:
- SEO-sourced outcomes: organic was the first touch
- SEO-assisted outcomes: organic showed up somewhere in the touch path
Use this table as the monthly pipeline tracker:
| Metric | This Month | Last Month | MoM Change |
|---|---|---|---|
| Non-brand organic sessions | - | - | % |
| Qualified conversions | - | - | % |
| Conversion rate | - | - | % |
| SEO-sourced outcomes | $ - | $ - | % |
| SEO-assisted outcomes | $ - | $ - | % |
| Influenced pipeline | $ - | $ - | % |
| Closed-won contribution | $ - | $ - | % |
Only fill in the dollar fields when CRM attribution is stable from month to month. On a content-mature B2B site, 25% to 40% of new pipeline should include an organic page somewhere in the touch path.
If that share comes in much lower, check the setup. In many cases, the problem is tracking - SEO landing pages may be tagged as campaign sources, or first-touch fields in HubSpot or Salesforce may not be set up the right way.
Using the right B2B SEO tools for lead generation can help automate this tracking. Next, tie these outcomes back to content output and technical health. A regular technical SEO audit ensures that tracking scripts and site performance don't interfere with these conversion metrics.
Content, Technical Health, and Trend Notes
Content output for the month
Use this section to show why rankings, clicks, or conversions changed this month.
Report every page that was launched, refreshed, consolidated, or retired. Tie each action to a topic cluster and buying stage. Then call out which shipped pages were most likely to move rankings, clicks, or conversions.
| Content Action | What to Report | Metric to Watch |
|---|---|---|
| New publication | Topic, target cluster, buying stage | Indexation and first-page rankings |
| Content refresh | Which page, why it was updated | CTR and ranking change |
| Consolidation | Which URLs merged, what was redirected | Cluster sessions |
| Retirement | What was removed and why | Crawl efficiency |
Buying stage matters here. If the month included more bottom-of-funnel comparison, pricing, or decision-stage pages, that will usually matter more to leadership than a month packed with top-of-funnel blog posts - even if total page output was lower.
After that, check whether technical issues supported those content gains or got in the way.
Technical health status
Report only what changed, what is still broken, and whether it affected rankings or conversions. Skip minor issues unless they changed visibility, traffic, or conversion performance.
Aim for 85%+ of submitted URLs indexed and generating impressions in the last 28 days. If that rate drops, look at whether the gap comes from a quality problem or a crawl-budget problem. That split matters because the fix is not the same.
Flag any Core Web Vitals regression right away. A mobile pass rate below 60% is high risk. New third-party scripts and CMS plugin updates often cause the problem. They can quietly drag down LCP or INP between reporting periods.
Trend notes and next steps
Wrap this section by connecting content, visibility, and conversion movement to one clear next-step decision.
If rankings went up but traffic stayed flat, check whether AI Overviews are taking clicks. If CTR fell on pages that held position or moved up, rewrite those pages so they do a better job serving as the source AI summaries cite.
Lead with click-assisted conversion rate and content-influenced pipeline.
Then sum up visibility, non-brand sessions, qualified conversions, assisted pipeline, content shipped, and technical status in one paragraph. Use that summary to point next month's budget, content work, or technical work in the right direction. End by naming one priority for next month - a page cluster, technical fix, or conversion path.
FAQs
Why should non-brand metrics lead the report?
Because non-brand metrics give you a cleaner read on net-new acquisition and whether SEO is bringing in people who don’t already know your brand.
Total sessions or clicks can get padded by brand searches. And those searches often say more about reputation, PR, or paid campaigns than SEO itself. When you lead with non-brand metrics, it becomes much easier to separate vanity growth from actual SEO performance.
How do I separate SEO-sourced from SEO-assisted pipeline?
SEO-sourced pipeline means organic search was the last touchpoint before conversion. In GA4, that often shows up under Organic Search.
SEO-assisted pipeline means an organic page showed up at any point in the buyer journey. It didn’t have to be the final step to matter.
To track this, use GA4 attribution or Advertising reports. Then connect GA4 to your CRM so you can see any-touch influence, not just last-click data.
If your attribution setup is limited, take a simpler route. Compare CRM data with GA4 key events and Google Search Console trends. It’s not perfect, but it can still show whether SEO is helping move deals along.
The big thing is consistency. Pick one attribution model and stick with it.
What if traffic grows but qualified conversions do not?
It usually points to a mismatch between user intent and the landing page experience.
A common issue is content that sits too high in the funnel. It brings in people who want information, not prospects who are ready to buy.
Review landing page changes from the prior 60 days, including CTA placement, form length, and layout updates. If the page is technically sound, tighten the CTAs and internal links, make sure the content lines up with the right funnel stage, and compare growth in non-branded queries against branded queries.