Click-through rates (CTR) vary widely depending on the type of market you're targeting. Niche markets, with their specific and immediate user intent, often see much higher CTRs compared to broad markets, which cater to larger, more exploratory audiences. Here's what you need to know:
- Niche Markets: CTRs range from 5% to 13% or more. These campaigns focus on precise user needs (e.g., "emergency boiler repair") and typically deliver higher engagement due to reduced competition and clearer intent.
- Broad Markets: CTRs average 2% to 4%. These campaigns target diverse audiences, often in research phases, and prioritize traffic volume over high CTRs.
Key Takeaways
- Platform Differences: Search ads outperform display ads in CTR - 3.52% vs. 0.46% on average (Q1 2026).
- Industry Variation: Travel & Hospitality leads broad markets with a 4.68% search CTR, while niche industries like Arts & Entertainment can hit 13.10%.
- Cost-Per-Click (CPC): High CTR doesn't always mean high CPC. For example, Arts & Entertainment enjoys low CPCs ($1.60) despite high CTRs, while Legal Services sees lower CTRs (~4.24%) but higher CPCs ($8.58+).
Quick Comparison
| Metric | Niche Markets | Broad Markets |
|---|---|---|
| Typical CTR | 5% – 13%+ | 2% – 4% |
| Audience Size | Small, targeted | Large, diverse |
| User Intent | Immediate | Informational |
| CPC Range | $3.00 – $23.00+ | $0.85 – $2.34 |
Understanding these benchmarks helps set realistic goals and refine campaigns for better performance, whether you're targeting a niche or broad audience.
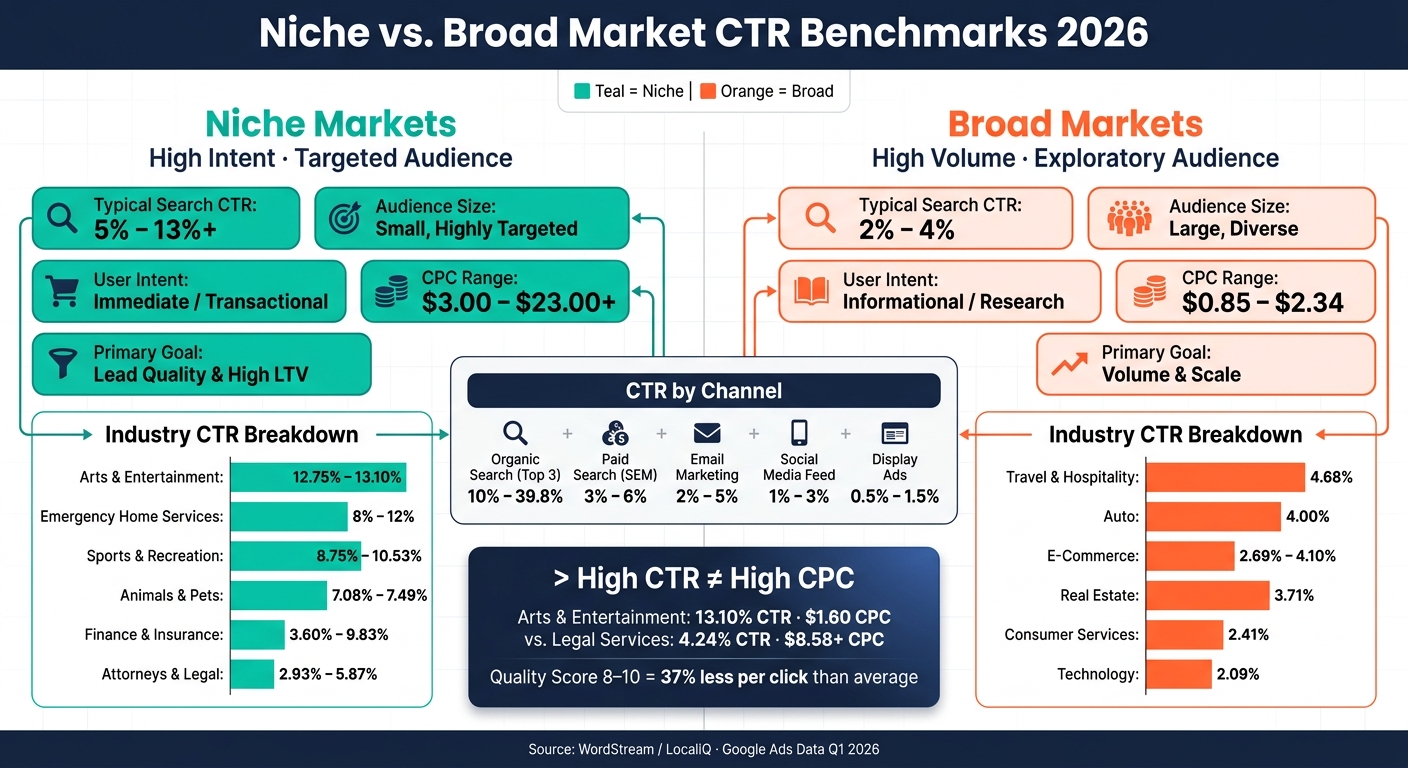
Niche vs. Broad Market CTR Benchmarks 2026
CTR Benchmarks in Broad Markets
What Are Broad Markets?
Broad markets cover high-traffic industries like e-commerce, consumer services, automotive, and travel, often utilizing top SEO marketing tools to manage scale. These sectors cater to a wide range of users, from casual browsers to those ready to make a purchase. While this diversity offers plenty of opportunities, it also creates unique challenges due to the mix of user intent.
Typical CTR Ranges in Broad Markets
In 2026, the average click-through rate (CTR) for search ads in broad markets ranges between 3.17% and 3.41%, while display ads hover around 0.46%. However, CTRs can differ significantly depending on the industry. For instance, Travel & Hospitality boasts a leading search CTR of 4.68%, while Consumer Services lags behind at 2.41%. Here's a breakdown of CTR benchmarks by industry:
| Industry | Avg. Search CTR | Avg. Display CTR |
|---|---|---|
| Travel & Hospitality | 4.68% | 0.47% |
| Auto | 4.00% | 0.60% |
| E-Commerce | 2.69%–4.10% | 0.51%–0.59% |
| Real Estate | 3.71% | 1.08% |
| Consumer Services | 2.41% | 0.51% |
| Technology | 2.09% | 0.39% |
These benchmarks offer a baseline for evaluating campaign performance and help shed light on the challenges that come with advertising in broad markets.
Challenges in Broad Market Campaigns
One of the biggest hurdles in broad market campaigns is navigating the mixed intent of audiences. Many users are in the early stages of research rather than ready to buy, which naturally lowers CTRs. On top of that, generic ad messaging often fails to connect with any specific group, making it even harder to drive meaningful engagement.
Competition is another major factor. Crowded search results mean ads must fight for attention, and standing out becomes increasingly difficult. Adding to the complexity, AI Overviews now appear in 47% of informational searches, reducing paid CTRs by 58%–68%.
As Imrana Essa from Usermaven aptly noted:
"If 2025 was the year of AI automation in Google Ads, 2026 is the year of precision."
This push for precision highlights how advertisers are adapting to the challenges of broad market advertising. Understanding these benchmarks and obstacles is key before diving into how niche markets compare.
sbb-itb-5be333f
CTR Benchmarks in Niche Markets
What Are Niche Markets?
Niche markets zero in on highly specific audience segments with unique needs, often reflected in long-tail keywords. For example, someone searching for "emergency boiler repair Chicago" has a much clearer intent than someone searching for "plumbing." Similarly, "personal injury attorney free consultation" conveys a specific need compared to the broader term "lawyer." This sharper focus on user intent allows niche markets to stand out in performance metrics, particularly in click-through rates (CTR).
Typical CTR Ranges in Niche Markets
Niche campaigns often achieve higher CTRs because they cater to well-defined user intent. For example, in 2026, the following industries reported notable CTR ranges:
- Arts & Entertainment: 12.75%–13.10%
- Sports & Recreation: 8.75%–10.53%
- Emergency Home Services: 8%–12%
Here's a breakdown of CTR benchmarks across different niche industries:
| Industry / Vertical | Typical Search CTR | Intent Level |
|---|---|---|
| Arts & Entertainment | 12.75% – 13.10% | High |
| Sports & Recreation | 8.75% – 10.53% | High |
| Animals & Pets | 7.08% – 7.49% | High |
| Emergency Home Services | 8% – 12% | Very High |
| Finance & Insurance | 3.60% – 9.83% | High |
| Attorneys & Legal | 2.93% – 5.87% | High |
Interestingly, higher CTRs often align with lower cost-per-click (CPC). For instance, Arts & Entertainment achieves a peak CTR of 13.10% with an average CPC of around $1.60. On the other hand, Legal Services, despite a lower CTR of approximately 4.24%, commands a much higher CPC of $8.58. This disparity is driven by the value of a single legal conversion, which can be worth thousands of dollars, justifying the higher CPC for fewer clicks.
Advantages of Niche Targeting
One of the biggest perks of niche targeting is its ability to align closely with user intent. As SEO expert Ashwani Kumar Sharma from eSign Web Services explains:
"Long-tail queries often deliver higher CTR because intent is clearer and competition is narrower."
With reduced competition in niche markets, ads don’t have to work as hard to gain visibility. Additionally, improving Quality Scores can significantly lower CPC - by as much as 30–50%. Advertisers with Quality Scores between 8 and 10 typically pay about 37% less per click compared to the average.
Niche targeting also tends to deliver higher conversion rates, which helps lower the overall cost per lead (CPL). This is because fewer unqualified clicks mean advertisers are reaching more of the right audience, making niche targeting a cost-effective strategy.
What Is a Good CTR for Google Ads - Is the Industry Lying To You? [2025]
Niche vs. Broad CTR Benchmarks: A Direct Comparison
Let's dive deeper into how niche and broad markets stack up when it comes to CTR performance and the factors that drive these differences.
Comparison Table: Key Metrics
To see the contrast clearly, here's a side-by-side look at the metrics for niche and broad markets:
| Metric | Niche Markets | Broad Markets |
|---|---|---|
| Typical Search CTR | 5% – 13%+ | 2% – 4% |
| Audience Size | Small, highly targeted | Large, exploratory |
| CPC Range | $3.00 – $23.00+ | $0.85 – $2.34 |
| User Intent | Immediate / Transactional | Informational / Research |
| Primary Goal | Lead quality & high LTV | Volume & scale |
| Competition Level | Intense for specific, high-value terms | High volume, competitive for generic terms |
This comparison highlights the stark differences in audience targeting, cost, and intent between the two market types.
Key Differences in CTR Benchmarks
The fundamental difference between niche and broad markets lies in their focus: niche campaigns prioritize precision, while broad campaigns aim for scale. Niche markets may have a smaller audience, but they often deliver higher CTRs and conversions. On the other hand, broad campaigns trade higher CTRs for sheer traffic volume.
Take, for example, the Dating & Personals niche, where search CTRs range between 6.05% and 9.42%. Compare that to the Technology sector - a broad market - where CTRs average just 2.09%–3.17%. That’s a difference of 3x to 4x, driven largely by the specificity of user intent during searches.
"A 2% CTR in one vertical might signal a campaign in trouble, while that same number in another vertical is considered strong performance." - Kreativa Group
Interestingly, high CTR doesn’t always mean high CPC. For example, Arts & Entertainment boasts some of the highest CTRs (up to 13.10%) while maintaining a relatively low CPC of $1.60. In contrast, Legal Services sees a much lower CTR (~4.24%) but commands CPCs as high as $23.19 due to the high value of each click.
Factors That Influence CTR Differences
Several campaign-specific factors contribute to these CTR differences. Three key elements often shape CTR outcomes: funnel stage, ad format, and channel selection.
Funnel stage plays a massive role. Bottom-of-funnel queries, where users are ready to take action, naturally yield higher CTRs. In contrast, top-of-funnel queries - more exploratory in nature - generate more impressions but fewer clicks. This is why niche campaigns, often focused on bottom-of-funnel queries, tend to see better CTR performance.
Channel selection is equally crucial. Search ads typically outperform display ads due to the higher intent of users actively searching. Retargeting ads, however, can close the gap by delivering better CTRs than standard display ads.
"Industries where ad messaging closely mirrors the search query tend to outperform those where the connection feels generic." - Kreativa Group
Finally, ad format can amplify results. Expanded formats with features like sitelinks, callouts, and snippets improve visibility on SERPs, which is particularly important in broad markets. In niche markets, the specificity of the ad message often carries more weight and drives stronger engagement.
Altogether, these factors explain why niche and broad markets perform so differently in terms of CTR benchmarks. Each market type has its own strengths, shaped by the intent, targeting, and structure of the campaigns. To maximize these strengths, businesses often leverage specialized SEO tools and services to refine their targeting strategies.
How to Use CTR Benchmarks to Evaluate Performance
Let’s dive into how you can use CTR benchmarks to assess and fine-tune your campaign performance, building on the differences between niche and broad market strategies.
Using Benchmarks as Reference Points
Think of CTR benchmarks as a guide, not a strict measure of success. They help you understand where you stand in your industry and prevent unrealistic expectations.
"Benchmarks don't exist to shame your numbers. They exist to protect you from unrealistic pressure, misinterpretation, and wasted effort." - Ashwani Kumar Sharma, eSign Web Services
If your CTR is far below average - say, 50% lower - it’s worth investigating. Issues like poor mobile user experience, irrelevant snippets, or mismatched ad copy could be the culprits. However, a smaller dip, such as 10–15% below the median, might just reflect normal variations in keywords or devices.
Your historical data can be even more insightful. Comparing month-over-month or year-over-year performance within your own campaigns often reveals trends that broader industry averages might miss.
Next, let’s explore how to set realistic CTR goals based on the type of campaign you’re running.
Setting Goals for Niche vs. Broad Campaigns
Your CTR targets depend heavily on the campaign type. For niche campaigns using brand keywords, CTRs often range from 10% to 20%. On the other hand, broad campaigns with non-brand terms typically see CTRs between 2% and 5%, even when they rank in top positions. Misclassifying these campaigns can distort your expectations.
For broad campaigns, starting near the industry median is a good rule of thumb. For example, e-commerce campaigns targeting generic products might aim for CTRs between 2.69% and 4.10% on search. Meanwhile, niche campaigns with high-intent keywords, like those in legal services, should aim higher - around 2.93% to 5.87%.
Different types of ads also require tailored goals. Google Shopping ads average a CTR of about 0.86%, while standard Search ads typically achieve CTRs between 3.17% and 3.8%. Comparing these directly can lead to misunderstandings, so it’s crucial to account for the unique nature of each campaign type.
Now, let’s look at how to apply these benchmarks across various channels.
Applying Benchmarks Across Channels
Every marketing channel has its own CTR baseline, and understanding these differences is key to optimizing your efforts. Here’s a quick breakdown:
| Channel | Typical CTR Range | Primary Goal |
|---|---|---|
| Organic Search (Top 3) | 10% – 39.8%+ | Trust & Authority |
| Paid Search (SEM) | 3% – 6% | Direct Response |
| Email Marketing | 2% – 5% | Relationship Nurturing |
| Social Media (Feed) | 1% – 3% | Engagement/Awareness |
| Display Ads | 0.5% – 1.5% | Brand Awareness |
The key takeaway here is intent alignment. Search campaigns generally perform better because they target users actively seeking information or solutions, leading to higher CTRs. In contrast, display ads focus on top-of-funnel awareness, where CTRs around 0.46% to 0.58% are perfectly acceptable.
"A 'good' CTR is less about hitting a universal benchmark and more about understanding what is achievable and effective for your specific goals, channel, and audience." - David Pombar, Trackingplan
Don’t forget to consider device performance, too. Mobile campaigns tend to average a CTR of 4.2%, while desktop campaigns hover around 3.5%.
Tools and Resources for CTR Benchmarking
Where to Find CTR Benchmark Data
Having access to reliable CTR benchmark data can make a big difference when evaluating performance across marketing channels. Several platforms stand out for their comprehensive data and insights.
WordStream/LocaliQ offers a wealth of data, tracking paid search metrics like average CTR, CPC, and cost-per-lead across thousands of advertiser accounts. This platform-specific data is a helpful complement to earlier benchmarks, giving marketers a clearer picture of industry trends. For channel-specific insights, the Google Ads Transparency Report is another go-to resource, providing performance metrics straight from Google itself.
For businesses in niche areas like e-commerce or direct-to-consumer (DTC) brands, tools like Triple Whale and Varos are invaluable. These platforms segment benchmarks by business model, such as DTC or B2B SaaS, allowing for more relevant comparisons. Meanwhile, Search Engine Land's CTR Benchmark Tool allows for even more granular filtering by country, industry, and channel. Instead of just flat averages, it presents data in percentile ranges, such as the top 25% versus the bottom 25%.
"The best benchmark is always your own past performance. Use this benchmark tool to add context and compare trends." - Search Engine Land
Another standout tool is BrightEdge, which is particularly timely as AI Overviews begin to reshape search results. It tracks how these AI-driven changes impact CTR, helping marketers understand unexpected drops in performance. On the paid search side, Optmyzr provides detailed, aggregated data for deeper analysis. Together, these tools offer a mix of broad market insights and niche-specific data, forming a solid starting point for any CTR benchmarking effort.
Finding Benchmarking Solutions with Top SEO Marketing Directory
For those working in specialized markets, finding granular benchmarks is critical. While broad reports are a good starting point, they often fall short when applied to niche or low-volume industries. This is where resources like the Top SEO Marketing Directory come into play.
The directory connects marketers with SEO agencies and analytics platforms that focus on niche-specific benchmarks. When exploring options, it’s smart to look for agencies with proven experience in your industry - whether it’s legal, healthcare, or B2B SaaS. Additionally, tools that integrate with Google Search Console and Google Ads can automate comparisons against industry medians, saving time and effort.
The directory also highlights tools designed to improve Quality Scores and landing page conversion rates (CRO), both of which directly influence CTR. This is especially important because advertisers with a Quality Score of 8–10 can pay about 37% less per click than the industry average. Focusing on these areas can often yield better returns than chasing CTR improvements alone.
Conclusion: Key Takeaways on Niche vs. Broad CTR Benchmarks
Summary of Key Differences
When comparing niche and broad market CTRs, the gap often comes down to user intent. Niche markets, like "emergency plumber near me" or specific "arts and entertainment" searches, tend to draw users with immediate needs. This urgency often results in CTRs as high as 12.75%. On the other hand, broad markets - such as B2B/SaaS or Technology - cater to users in research or exploration phases, where CTRs typically hover around 2%–3%.
These distinctions directly influence campaign strategies. Niche campaigns thrive by addressing immediate intent with highly tailored ad copy. Broad campaigns, however, must focus on optimizing conversions and building long-term engagement to compensate for lower CTRs. Understanding these differences is crucial for refining your approach.
Actionable Tips for Marketers
Use these insights to fine-tune your campaigns. While benchmarks provide helpful context, they should guide your strategy rather than define it:
"Benchmarks are reference points, not targets. Your account's optimal CPC, CTR, and conversion rate depend on your margins, LTV, and competitive landscape." - Digital Applied
For niche campaigns, consider these tactics:
- Focus on long-tail keywords.
- Use precise negative keyword filters.
- Craft location-specific ad copy to capture local intent.
For broad market campaigns, try the following:
- Use visually engaging creatives to stand out.
- Highlight strong brand signals in your messaging.
- Adjust bids by device, especially since mobile accounts for 65% of Google Ads clicks but converts at 3.28%, compared to 5.06% on desktop.
Regardless of your market type, improving your Quality Score is a universal game-changer. Raising it from 5 to 7 can reduce your effective CPC by over 40%, while scores of 8–10 can save you 37% per click compared to the average. These small changes can make a big difference in your campaign's efficiency and ROI.
FAQs
What should I optimize first if my CTR is below my industry benchmark?
If your CTR isn't meeting industry standards, the first step is to check if branded keywords are skewing your results. These keywords typically perform better than generic ones, so it's important to separate their impact. Once you've ruled this out, shift your attention to improving your ad copy, fine-tuning your negative keywords, and ensuring your targeting matches your audience's intent. Need extra help? The Top SEO Marketing Directory offers expert tools and services to boost your campaign's performance.
How do I set a realistic CTR goal for my niche vs. broad campaigns?
When determining realistic click-through rate (CTR) goals, it's helpful to start by comparing your performance to industry and platform benchmarks. For instance, the average CTR for search ads is around 3.17%, while display ads typically hover at 0.46%. These numbers provide a good starting point, but your goals should be tailored to your specific niche.
Niches with high intent or location-specific targeting often achieve better CTRs. On the other hand, broader categories, such as B2B industries, may naturally have lower engagement rates. To refine your approach:
- Dive into historical data: Look at past performance to identify trends and patterns.
- Segment branded vs. non-branded keywords: Branded terms often perform differently than generic ones.
- Test ad relevance: Experiment with messaging and targeting to see what resonates most with your audience.
Using benchmarks as a baseline and layering in these insights will help you set achievable and meaningful CTR goals.
How can I tell if a CTR drop is caused by AI Overviews or my ads?
If you're noticing a drop in your click-through rate (CTR), it's important to figure out whether it's tied to AI Overviews (AIOs) or your ads. Here's how to break it down:
- Use analytics tools to segment your queries. Look at the historical CTR for keywords where AIOs appear and compare it to periods when they didn’t.
- If you find the drop is only happening with these specific keywords, AIOs are likely the culprit. On the other hand, a more general decline could point to other issues, like ad performance or broader search trends.
One more thing to consider: If your site is being cited in AIOs, check if that’s giving your CTR a boost. Being mentioned can act as social proof, which might help drive clicks.