If I’m checking mobile responsiveness in 2026, I look at INP - not FID. Google replaced FID on March 12, 2024, and the switch matters because INP measures the full interaction, while FID only measured the first input delay.
Here’s the short version:
- INP is the current Core Web Vitals responsiveness metric
- FID is now a legacy metric
- INP checks all qualifying interactions during a visit
- FID checked only the first interaction
- INP includes input delay, processing, and the next paint
- FID included only the delay before input handling began
- On mobile, this gap shows up fast because slower phones and heavy JavaScript make lag easier to feel
- One cited CrUX analysis found 97% of desktop origins pass INP, versus 77% of mobile origins
So if a page passed FID before, that does not mean it passes INP now. In fact, the article points out that many mobile sites looked fine under FID but still had slow menus, filters, forms, and cart actions later in the session.
What I take from this is simple:
use Search Console and CrUX to review mobile INP, use PageSpeed Insights to connect field data to lab signals, and use Lighthouse to spot long main-thread work through TBT. I’d treat old FID reports as past context only.
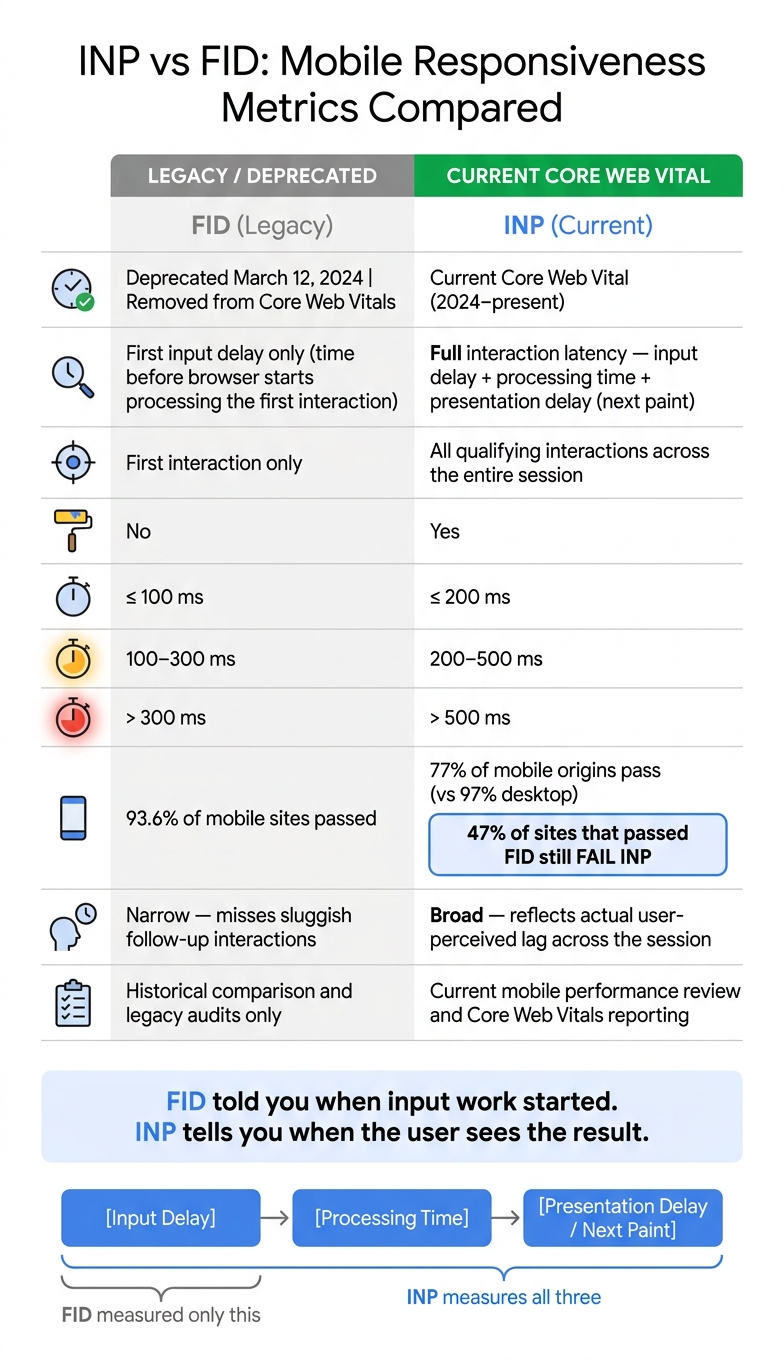
INP vs FID: Core Web Vitals Responsiveness Metrics Compared
How To Optimize Interaction to Next Paint
sbb-itb-5be333f
Quick Comparison
| Criteria | INP | FID |
|---|---|---|
| Status in 2026 | Current Core Web Vitals metric | Legacy metric |
| What it measures | Full interaction latency | First input delay only |
| Scope | All qualifying interactions in a visit | First interaction only |
| Includes paint timing | Yes | No |
| Good threshold | ≤ 200 ms | ≤ 100 ms |
| Best use today | Current mobile performance review | Historical comparison |
If I had to sum it up in one line: FID told me when input work started, while INP tells me when the user sees the result.
INP on Mobile: What It Measures and Why It Replaced FID
Interaction to Next Paint (INP) measures how long it takes, in milliseconds, for a page to visually update after a user interaction, such as a tap, click, or key press, across the full visit - not just the first action. It looks at the whole path: user input, JavaScript and event handling, rendering, and then the next paint.
Definition and Thresholds
INP is reported as the worst interaction during a visit, then summarized at the 75th percentile of real-user data. Put simply, a page passes when most visits come in at 200 ms or less.
| INP Score | Threshold (p75) | Status |
|---|---|---|
| Good | ≤ 200 ms | Passes Core Web Vitals |
| Needs improvement | > 200 ms and ≤ 500 ms | Requires attention |
| Poor | > 500 ms | Failing |
Google's guidance is direct: sites should "strive to have an INP of less than 200 ms" for a good user experience.
Why INP Works Better on Mobile
FID only measured the delay before the browser started processing the first interaction. It did not include the time needed to update the UI and paint the result. INP measures input delay, processing time, and presentation delay, and it applies to every interaction in the session - not just the first tap.
That difference matters on mobile. A shopper might open a menu, apply a product filter, and add an item to cart in the same session. FID would score only the menu tap. INP scores all three.
This is where mobile pages often run into trouble. On mid-range Android devices, later actions like filtering a product list or submitting a form can hit long JavaScript tasks, heavy event handlers, and expensive layout work - the kind of slowdown FID never showed.
The numbers make the point. While 93.6% of mobile sites had "good" FID, a much smaller share passed INP, and 47% of mobile origins that passed FID still fail INP at p75. That's why FID left many teams thinking things were fine on mobile when they weren't, and why INP took its place.
FID on Mobile: A Legacy Metric with a Narrow Scope
First Input Delay (FID) measures the time from a user's first tap, click, or keypress to when the browser can start processing that input. On mobile, that meant FID could miss the lag people felt after that first tap. In plain English, it looked at a thin slice of the visit, not the whole experience. That narrow scope is why FID often failed to reflect the mobile lag users actually noticed.
Definition, Threshold, and Historical Use
FID thresholds were:
| FID Score | Threshold (p75) |
|---|---|
| Good | ≤ 100 ms |
| Needs improvement | > 100 ms and ≤ 300 ms |
| Poor | > 300 ms |
Because FID only measured the first interaction, many mobile sites looked fine in reports while users still hit slow menus, laggy filters, and sluggish checkout steps later in the same session. A page could load fast and still feel slow on later taps. So yes, FID could give a page a good rating even when later mobile actions still lagged. That gap is why Google replaced FID with INP.
Why FID Is Now a Legacy Reference
So where does that leave FID now? As a legacy reference, not a current Core Web Vitals signal. FID no longer counts toward Core Web Vitals. Google Search Console removed FID from Core Web Vitals reports, and PageSpeed Insights followed with deprecation notices. When you're reading older mobile audits, use FID as historical context. It's still useful for older mobile reports and side-by-side historical comparisons.
The next section compares FID and INP directly across scope, status, and mobile reporting.
INP vs FID on Mobile: Key Differences
Side by side, the difference is simple: FID measured the first delay. INP measures the full interaction.
| Aspect | FID (Legacy) | INP (Current) | Mobile Implications |
|---|---|---|---|
| Interaction scope | First interaction only | All qualifying interactions across the session | Captures repeated mobile interactions. |
| Phases measured | Input delay only | Input delay + processing time + presentation delay | Includes delay, processing, and paint. |
| Thresholds | Good ≤ 100 ms | Good ≤ 200 ms; needs improvement 200–500 ms; poor > 500 ms | Broader scope, so FID and INP pass rates are not comparable. |
| Reporting status | Deprecated; removed from Core Web Vitals | Current Core Web Vital | Current reporting uses INP. |
| Matches user-perceived lag | Narrow; misses sluggish follow-up interactions | Broad; matches actual user-perceived lag | Matches user-perceived lag. |
The gap stands out once you look at three things: scope, phases, and reporting status.
Interaction Scope and Phases Measured
This matters on mobile because menu taps, filters, and checkout actions each create their own delay.
On a phone, that adds up fast. A user might open a hamburger menu, apply a product filter, and tap "Add to Cart" in the same visit. Those are separate interactions. FID only scored the first one. INP looks across the session and surfaces the slowest representative interaction, which is why it catches issues FID often missed.
There’s another big difference: what each metric measures. FID looked only at input delay. INP goes further. It includes input delay, processing time, and presentation delay. In plain English, INP tracks not just when the browser starts handling the tap, but also how long the work takes and when the updated screen finally appears.
Thresholds, Status, and Mobile Pass Rates
A site can pass FID and still fail INP because INP measures more than the first delay.
That’s why pass rates don’t line up cleanly. FID used a good threshold of 100 ms or less. INP uses 200 ms or less for good, 200–500 ms for needs improvement, and more than 500 ms for poor. Even though INP allows a higher number for a good score, it covers much more of the user journey, so the two metrics are not apples to apples.
Reporting changed too. FID is deprecated and was removed from Core Web Vitals. INP is the current Core Web Vital. So if you're looking at mobile performance today, INP is the metric that matters in current reporting.
The main point is coverage: INP shows slow follow-up interactions that FID never counted.
Next, check which reports still surface FID and which older audits need to be read as historical only.
Reporting, Audits, and What Teams Should Review Now
How Mobile Reporting Changed Across Major Tools
Now that the metric shift is settled, the next step is simple: know where to read mobile INP and how to treat older FID exports.
| Tool | Metric in 2026 | Mobile View | Use For |
|---|---|---|---|
| Google Search Console | INP field data; no FID in current reports | Separate mobile and desktop reports based on real user data | High-level URL grouping and pass/fail status |
| Chrome UX Report (CrUX) | INP distributions (Good / Needs Improvement / Poor) | Device-specific histograms for mobile and desktop | Segmenting field data by device and tracking trends over time |
| PageSpeed Insights | INP field data when available, plus lab TBT | Mobile tab shows CrUX INP when data is available | Bridging field symptoms with lab-level diagnostics |
| Lighthouse | No INP; uses TBT as a lab proxy | Mobile audits surface main-thread blocking | Identifying long tasks and main-thread blocking causes |
One point matters more than it may seem: Lighthouse does not measure field INP. It measures load-time blocking only, which means a page can show 0 ms TBT and still have poor field INP. That’s why teams should use Search Console and CrUX for field INP, then use Lighthouse to dig into the cause.
How to Use Old FID Audits Without Overvaluing Them
Old FID reports still have a job. They can help teams spot past blocking patterns. If a page kept showing Poor FID, that’s a strong sign the main thread was blocked on first input.
The useful move is to go back to those old FID findings and ask a plain question: what caused the delay? In many cases, the same issues show up again - long JavaScript tasks, heavy event handlers, blocking third-party scripts, and expensive client-side rendering. Those findings should be mapped into the current INP backlog so the same code paths get attention in today’s audits.
At the same time, teams should not read a Good FID score as proof that a page is responsive now. FID only looked at the first input. INP looks at interactions across the session. So a page could pass FID and still fail INP when a user taps a filter, opens a menu, or hits the checkout button.
What Marketers and Operators Should Prioritize
The priority is straightforward: focus on mobile field INP first, then use lab TBT to find the cause, and treat FID as historical context.
A practical workflow looks like this:
- Check Search Console's Core Web Vitals report with the mobile filter on
- Find URL groups marked Poor or Needs Improvement for INP
- Run those URLs through PageSpeed Insights
- Connect the field score to TBT and JavaScript cost
For 2026 planning, INP is the current responsiveness benchmark. FID still has some use, but only in legacy reports and for long-term trend comparisons.
FAQs
Why can a site pass FID but fail INP on mobile?
A site can pass FID but fail INP because the two metrics look at different parts of responsiveness.
FID only measures the delay before the browser starts processing the first interaction. INP measures the full interaction - input delay, event handler execution, and the next visual update.
So a site might react fast at the start but still feel slow right after that.
What mobile interactions affect INP the most?
INP gets hit hardest on mobile, where interactions can stall the browser’s main thread. The biggest trouble spots are usually taps on buttons or links, plus form submissions and text input.
Common causes include heavy JavaScript, a complex or deeply nested DOM, long tasks, third-party scripts, and slow event handlers. Because INP measures the full interaction cycle, slow visual updates tend to do the most damage.
Which tools should I use to check mobile INP in 2026?
Use a mix of field and lab tools.
Start with Google PageSpeed Insights. It gives you CrUX field data alongside Lighthouse lab data, so you can see both what users experience and what shows up in a controlled test.
Use Chrome DevTools or the Web Vitals extension to debug interactions and spot long tasks. That’s often the fastest way to see where the page is getting stuck.
Google Search Console also matters. It helps you track aggregated mobile performance trends over the previous 28 days, which is useful when you want to watch movement over time instead of checking one page in isolation.
If you want broader technical audit options, Top SEO Marketing Directory lists additional SEO and performance tools.