If your page is slow to show, slow to react, or jumps while loading, people leave. That is the whole point of Core Web Vitals: Google checks whether your pages load fast enough, respond fast enough, and stay still enough for users to trust them.
Here’s the short version:
- LCP checks how fast the main content appears - good is 2.5 seconds or less
- INP checks how fast the page reacts after a click or tap - good is 200 ms or less
- CLS checks whether the layout shifts while loading - good is 0.1 or less
- To pass, a page needs to be good on all 3
- Google looks at field data from actual Chrome users at the 75th percentile over 28 days
- Mobile should be my first focus because that is usually where problems show up first
What I’d watch first:
- LCP problems often come from slow servers, large hero images, or render-blocking CSS/JS
- INP problems often come from heavy JavaScript, chat tools, tag managers, or long main-thread tasks
- CLS problems often come from images without dimensions, ad slots, banners, or font swaps
The main takeaway is simple: I would not fix pages one by one unless I had to. I’d start with the highest-traffic mobile templates and fix the worst metric tied to revenue pages first.
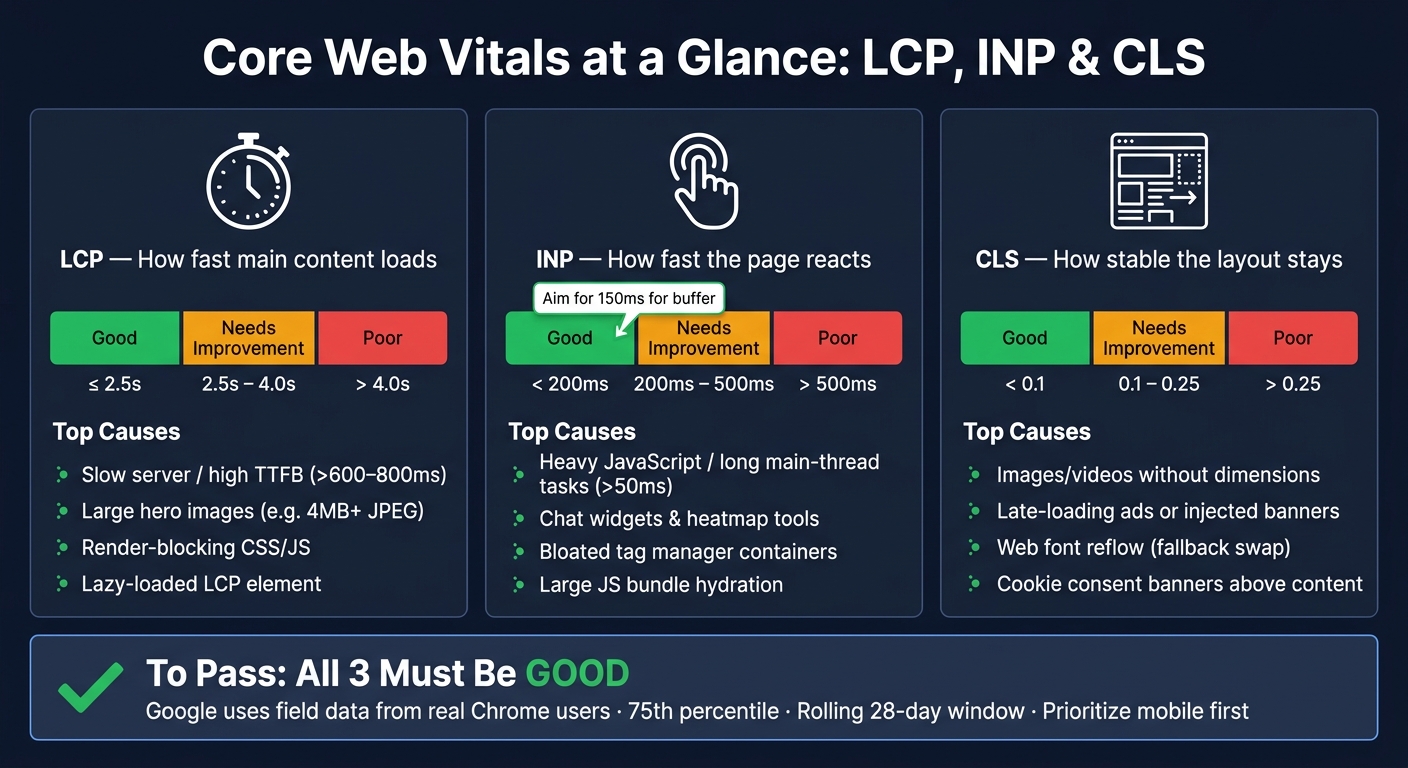
Core Web Vitals at a Glance: LCP, INP & CLS Benchmarks
Core Web Vitals 2025 Explained: INP, LCP, CLS & How to Boost Your Site Speed!
sbb-itb-5be333f
Largest Contentful Paint (LCP): How Fast the Main Content Loads
LCP measures how long it takes the largest visible element on the screen to render. On most pages, that’s the hero image, headline, or product image. Once the browser can paint that element fast, the next step is simple: find out what’s holding it back.
Good LCP is 2.5 seconds or less.
Common Causes of a Poor LCP Score
Most LCP issues come down to three things: server delay, heavy media, or code that gets in the way.
A slow server is often the first bottleneck. If Time to First Byte (TTFB) is above 600 ms to 800 ms, hitting a Good LCP is close to impossible.
Large hero media is another common problem. A bloated hero image - like a 4 MB+ JPEG - can drag the whole page down. Moving hero assets to WebP or AVIF can cut file size by 25% to 34% at the same visual quality. And if the LCP element is lazy-loaded, that’s a problem too. Remove loading="lazy" and use loading="eager" with fetchpriority="high".
Render-blocking CSS and JavaScript can also delay LCP. Heavy theme stylesheets, third-party scripts, and page builders that dump extra HTML onto the page can all slow the browser before it paints the main content.
How to Read LCP in SEO Reports
If your report includes a diagnostic breakdown, check the bottleneck type first. High Web Server Response Time usually points to the server. High Resource Load Delay often points to missing preload hints. Use top SEO tools to dig into the cause, but use field data to judge real-world LCP performance.
Here’s a quick way to map common LCP issues to likely fixes:
| Common LCP Problem | Likely Technical Fix | Business Impact |
|---|---|---|
| Oversized hero image | Convert to WebP/AVIF; resize to viewport dimensions; compress under 100 KB | Reduces data waste and speeds up perceived load |
| Lazy-loading the LCP element | Remove loading="lazy"; add fetchpriority="high" |
Prevents unnecessary delays in rendering main content |
| Slow server (high TTFB) | Upgrade hosting; implement a CDN or edge caching | Improves every downstream loading metric |
| Render-blocking CSS/JS | Inline critical CSS; defer non-essential scripts | Lets the browser paint the UI sooner |
| Page builder bloat | Flatten the DOM; reduce page-builder output | Improves overall responsiveness and load speed |
LCP shows when the page becomes visible. INP covers what happens after users start interacting.
Interaction to Next Paint (INP): How Responsive the Page Feels
INP measures the time between a click, tap, or key press and the next visual update. Put simply, it shows how responsive the page feels across the full visit. If LCP tells you when content shows up, INP tells you whether people can actually use it.
Good INP is below 200 ms. Between 200 ms and 500 ms, people start to notice lag. Above 500 ms, the interface can feel slow or even broken, and users often click more than once, which can make the delay worse.
Common Causes of a Poor INP Score
Poor INP usually comes from JavaScript, third-party tools, or heavy hydration.
JavaScript can monopolize the main thread and delay input response. On marketing sites, common INP problems include chat widgets like Intercom or HubSpot, heatmap tools like Hotjar, and tracking pixels. Any task over 50 ms can block input handling. Large JavaScript bundles and hydrating big JavaScript apps can also tie up the main thread. A bloated tag manager container can add even more blocking time.
How to Read INP in SEO and Performance Reports
Once loading speed is in decent shape, check whether interaction latency is the thing dragging the page down.
INP replaced FID and measures the full delay of every interaction. In reports, INP uses the 75th percentile of real-user field data over a rolling 28-day window. Field data helps you set priorities. Lab data helps you isolate the cause. Even a small number of slow interactions can push a page into Needs Improvement, even when most interactions are fast. A practical internal target is 150 ms so you have some buffer before the 200 ms threshold.
Use INP to find the slow interaction, then connect it to the script, widget, or template behind the delay.
| Interaction Type | INP Range | User Perception |
|---|---|---|
| Menu toggle / CTA click | < 200 ms | Instant and responsive |
| Form field / filter selection | 200–500 ms | Noticeable lag; user may wonder if it registered |
| Complex search / checkout | > 500 ms | Frustrating; users often rage-click, making it worse |
CLS is next, and it measures whether the page stays visually stable while it loads.
Cumulative Layout Shift (CLS): How Much the Page Moves Unexpectedly
CLS measures how much visible content shifts without warning while a page loads. It combines how much of the viewport moves and how far it moves. The score has no unit. A higher number means the page feels less stable.
Good CLS is below 0.1. Scores from 0.1 to 0.25 mean the page needs work, and anything above 0.25 is poor. This matters in simple, annoying ways. A visitor goes to tap "Add to Cart", then a late ad or banner appears and pushes the button out of place. That leads to mis-clicks, lost reading position, and abandoned carts. After that, the job is to figure out which elements are shifting and what's causing it.
Common Causes of a Poor CLS Score
Most CLS issues happen when the browser doesn't know how much space to set aside before content appears.
Images, videos, and iframes without explicit dimensions are a common problem. Add width and height attributes so the browser can reserve space ahead of time.
Late-loading ads, embeds, and injected banners can cause big shifts when they show up above content that's already on the page. Use CSS min-height to reserve space for ad containers. Keep cookie banners pinned to the bottom of the viewport so they don't push the page down.
Web fonts can trigger reflow when a fallback font switches to a custom font. Preloading key fonts and using font-display: optional or swap can help cut down these shifts.
Cookie consent banners placed above the main content after the page has rendered are another common source of CLS, especially on product and checkout pages.
How to Read CLS in Reports and Connect It to Page Templates
Once you know the cause, Search Console can tell you whether the issue is limited to one page or repeated across a template. If you need professional help auditing these patterns, you can find top SEO tools and services to assist with technical fixes. Google Search Console's Core Web Vitals report groups URLs by pattern, so you might see a whole batch of blog posts or product pages flagged together. That's good news. If one template has a hero image sizing problem, fixing that template can solve the issue across every page that uses it.
The table below links common layout issues to likely user impact and the templates where they often show up:
| Layout Issue | CLS Impact | Likely User Outcome | Common Template |
|---|---|---|---|
| Images without dimensions | High | Content jumps while reading; user loses place | Blog posts, product galleries |
| Late-loading banners or ad slots | High | User mis-clicks a link or ad accidentally | Homepage, category pages |
| Unreserved ad space | High | Buttons move unexpectedly | News articles, sidebar content |
| Web font reflow | Medium | Text reflows; user loses their place | Site-wide headers and navigation |
| Injected cookie notices | Medium | Content is pushed down | Product pages, checkout |
When Search Console groups CLS issues across many pages, fix the shared template instead of patching one URL at a time. Template-level patterns usually show you where to start first.
How to Use Core Web Vitals Data to Prioritize SEO and Site Fixes
Knowing what LCP, INP, and CLS measure is only half the work. The next step is figuring out what to fix first.
That order matters. If dev time is tight - and it usually is - you want to start with the issue that has the biggest business effect, then sort fixes by device and page template. In plain English: don't just fix what's broken. Fix what matters most.
How to Rank Fixes by Device, Template, and Revenue
Start with mobile.
Mobile often shows the worst real-user performance, so it gives you the clearest view of where your site is struggling. If you fix mobile first, you're dealing with the weakest part of your data right away.
Next, group affected URLs by template type in Google Search Console's Core Web Vitals report. This is where teams often save time. A template-level fix can improve dozens, hundreds, or even thousands of pages at once. That's a much better use of dev effort than patching single URLs one by one.
After that, weigh each fix against:
- Traffic volume
- Conversion value
- Page type, such as checkout flows and top landing pages
Pages tied to revenue should move to the front of the line. If a fix helps a checkout flow, a high-traffic landing page, or another page with direct business impact, it deserves more attention than a low-value page with the same metric issue.
Lab Data vs. Field Data: Which One Should Guide Decisions
Once you've ranked your fixes, use the right data source to decide what to ship.
Field data shows how real people experience your site. Lab data helps you spot the cause of a problem in a controlled test.
Field data comes from real Chrome users through the Chrome User Experience Report (CrUX) across a rolling 28-day window. This is the data Google uses for rankings. That point is easy to miss, but it's a big one: Google looks at real-user performance, not simulated tests.
Lab data comes from tools like Lighthouse and PageSpeed Insights. It's best for diagnosis. If you're trying to figure out why a page is slow or whether a change helped before release, lab data is the tool you want.
Use Google Search Console as your reporting baseline. Then use PageSpeed Insights or Chrome DevTools to test a specific fix before it goes live.
Conclusion: What to Watch First in LCP, INP, and CLS
Once you know where to focus, use field data to confirm the biggest wins. LCP, INP, and CLS each track a different part of page experience, so don't treat them in isolation. Look at them as one combined signal.
Start with the worst-performing metric on your highest-traffic mobile templates first. Good scores help protect rankings and revenue.
FAQs
Which Core Web Vital should I fix first?
Start in Google Search Console. Check which Core Web Vitals are marked Poor or Need Improvement.
If you need a place to begin, start with LCP. In many cases, it has the biggest effect on bounce and conversion rates.
If your LCP is already in good shape, move to the metric with the weakest field data. Then use PageSpeed Insights to spot the main bottlenecks.
One thing to keep in mind: to pass Core Web Vitals, you need to meet the threshold for all three metrics at the 75th percentile.
Why do lab scores and field data differ?
They differ because they track performance under different conditions. Lab data comes from controlled tests in a simulated setting. Field data shows what actual Chrome users experience across different devices, internet speeds, and browsing habits.
That gap matters. A page might look good in lab tests but struggle in the field - especially on older phones or slower connections.
Because Google uses field data for ranking, it’s the metric that matters most for your site’s performance.
How long do Core Web Vitals improvements take to show?
Core Web Vitals are based on a rolling 28-day window of real-user Chrome data. That means even if you fix an issue today, it can take up to 28 days for the full impact to show up in Google Search Console.
Tools like Lighthouse and Chrome DevTools can show changes right away while you're working. That's helpful for spotting fixes fast. But those tools don't reflect what actual users experience on your site.
So use both. Check Search Console to track how your site performs for real visitors over time, and run regular audits with Lighthouse or DevTools to catch regressions before they turn into bigger problems.