Engagement metrics are increasingly important for SEO because search engines like Google now prioritize user satisfaction over simple keyword matching. With the July 2025 Core Update, user behavior signals like time on page, clicks, and interactions play a bigger role in rankings. Pages that engage users - keeping them on-site longer and prompting meaningful actions - are rewarded with higher visibility.
Here’s what you need to know:
- Key Engagement Metrics: Time spent on a page, bounce rate, pages per session, scroll depth, and click-through rate (CTR) are essential for assessing content performance.
- Impact on SEO: Metrics like high bounce rates or low engagement indicate your content may not meet user expectations, potentially harming rankings.
- Tools to Track Metrics: Use Google Analytics 4 (GA4) for engagement tracking and Google Search Console (GSC) for search performance insights.
- Improvement Tips: Enhance page load speeds, refine navigation, and optimize content structure to boost engagement rates and user satisfaction.
Analyse SEO Performance with Google Analytics [Full Tutorial]
sbb-itb-5be333f
Tools for Tracking Engagement Metrics
Tracking how users interact with your content is crucial, and having the right tools makes all the difference. Three standout resources for gathering actionable data are Google Analytics 4 (GA4), Google Search Console (GSC), and the Top SEO Marketing Directory, which specializes in advanced solutions.
Google Analytics 4 (GA4)
GA4 takes a fresh approach to tracking by focusing on user interactions rather than just page views. Using an event-based model, it captures every user action - clicks, scrolls, video plays - as distinct events with specific parameters. It redefines engagement by tracking sessions that last over 10 seconds, include a conversion event, or result in multiple page views. This replaces the older bounce rate metric with an engagement rate, providing a clearer picture of how users interact with your content.
GA4 also automatically tracks when users scroll to 90% of a page. For more granular data, you can configure Google Tag Manager to track additional thresholds like 25%, 50%, and 75%. It’s worth noting that engagement rate and bounce rate are inversely related - if your engagement rate is 65%, your bounce rate will be 35%. While bounce rate isn’t visible by default in GA4 reports, you can add it manually using the customization tools. Plus, the 10-second engagement threshold can be extended up to 60 seconds, which is especially useful for content-heavy pages.
Google Search Console
GSC complements GA4 by focusing on how users find your site. While GA4 reveals what happens after users land on your pages, GSC provides insights into how they got there. It offers first-party data on impressions, clicks, click-through rates (CTR), and average keyword rankings.
"Google Search Console is the closest thing we have to first-party search truth".
Crystal Carter, Head of SEO Communications, highlights GSC's value. It helps you understand if your content matches user intent by showing the search queries that lead visitors to your pages. GSC also tracks Core Web Vitals - key metrics like Largest Contentful Paint (LCP), Interaction to Next Paint (INP), and Cumulative Layout Shift (CLS) - which directly impact user experience. For example, as of July 2025, only 44% of WordPress sites on mobile met all three Core Web Vitals thresholds.
"The CTR column in GSC is where I start every content audit. If a page has thousands of impressions and a 0.8 percent CTR, that is a title problem, not a content problem".
Tanner Medina, Co-Founder of Launchcodex, emphasizes the importance of CTR in content audits. Pages with many impressions but low CTR (below 2%) often need optimized title tags and meta descriptions. For instance, ABP News increased organic traffic by 30% in 2025 after applying GSC’s structured data suggestions, while MX Player tripled its search traffic by fixing indexing issues flagged in GSC. Keep in mind, GSC retains data for only 16 months, so exporting reports regularly is essential for long-term comparisons - especially as AI tools reshape search behavior.
Top SEO Marketing Directory
Once you’ve mastered GA4 and GSC, the Top SEO Marketing Directory can guide you to advanced tools for deeper engagement analysis. This resource categorizes tools by function - such as behavioral analytics, content optimization, and technical SEO - making it easier to find what fits your needs. Each listing includes ease-of-use ratings (Beginner, Intermediate, Advanced), allowing you to match tools to your skill level.
The directory also compares free and paid options, helping you scale your analytics stack based on your budget. For example, platforms like Microsoft Clarity, Mixpanel, and Amplitude offer features such as session replays and heatmaps for better understanding user behavior. Amplitude’s free tier even supports up to 50,000 monthly tracked users.
Additionally, the directory aggregates third-party reviews from sites like G2 and Capterra, giving you verified feedback before investing in tools. For instance, you can weigh premium tools like Semrush ($139.95/month) against budget-friendly alternatives like KeySearch ($24/month), which covers about 70% of Semrush’s functionality. The directory also tracks emerging trends, including tools for monitoring brand visibility in AI-driven platforms like ChatGPT and Claude. As AI Overviews continue to impact traditional search CTR - dropping from 28% in 2024 to 19% in 2025 - understanding your visibility across all search formats is becoming critical. This directory helps you stay ahead by pinpointing tools that refine your engagement tracking and strengthen your SEO strategies.
How to Measure Engagement Metrics: Step-by-Step
Step-by-Step Guide to Measuring SEO Engagement Metrics in GA4
Let’s dive into how you can measure engagement metrics effectively using GA4.
Setting Up Bounce Rate and Engagement Rate Tracking
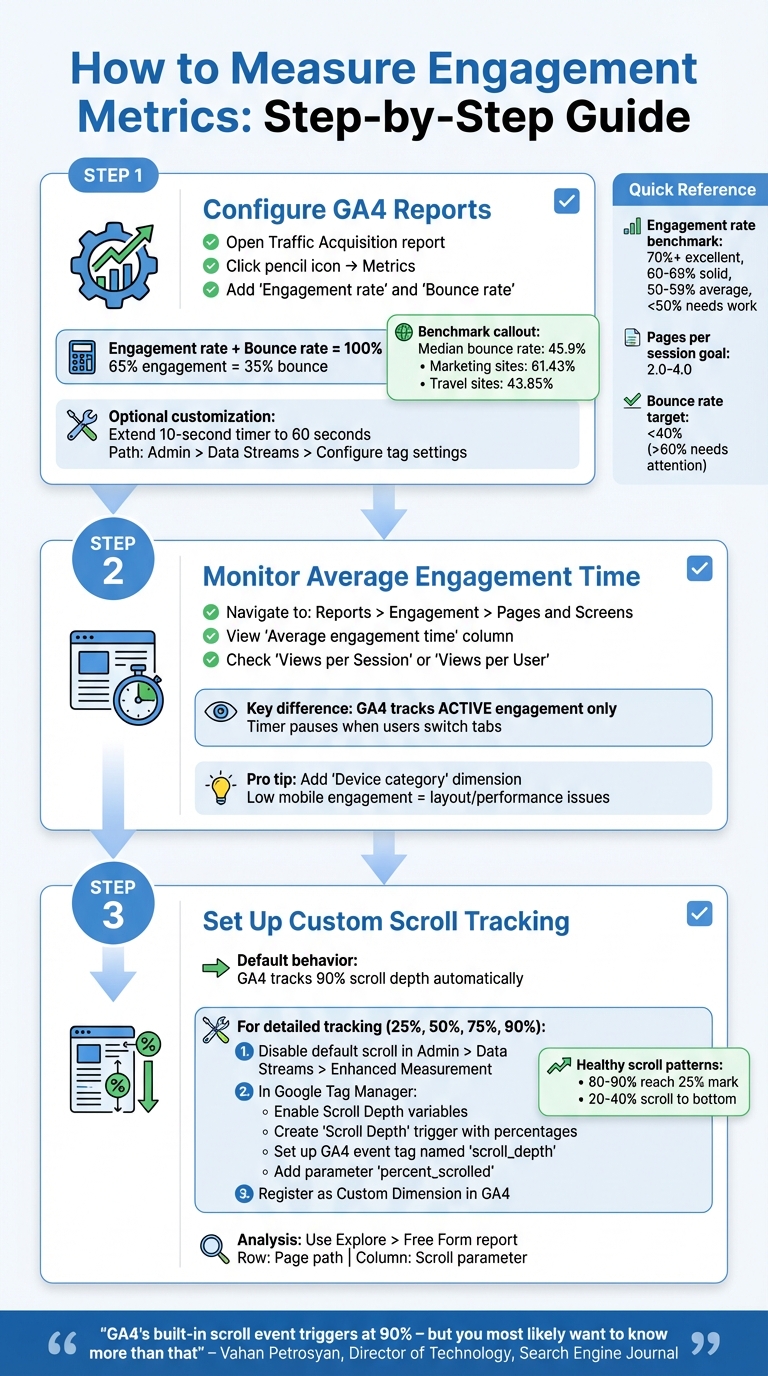
GA4 automatically tracks engagement rate and bounce rate through built-in events. However, these metrics don’t show up in standard reports by default. To add them, open a detailed report like Traffic Acquisition, click the pencil icon, go to Metrics, and include "Engagement rate" and "Bounce rate."
Here’s how these two metrics relate: bounce rate is simply the inverse of engagement rate. For example, if your engagement rate is 65%, your bounce rate will be 35%. Industry benchmarks show that the median GA4 bounce rate is about 45.9%. Specific industries vary - advertising and marketing sites average 61.43%, while travel sites see around 43.85%.
You can tweak the default 10-second engagement timer to better align with your site’s content. To do this, go to Admin > Data Streams, select your stream, and click Configure tag settings. From there, choose Show more and adjust the session timeout to extend the timer up to 60 seconds for pages with heavier content. Additionally, make sure key user actions, like form submissions or video plays, are marked as key events in your Admin settings. Any session that triggers a key event will automatically count as engaged.
Once you’ve set up these metrics, you’ll want to measure how long users interact with your content and how many pages they visit during a session.
Tracking Time on Page and Pages per Session
GA4 has replaced the old "Average Time on Page" with Average Engagement Time, which only tracks the time users actively engage with your page. This means the timer pauses if a user switches tabs or minimizes their browser [36,38,39].
To view this metric, head to Reports > Engagement > Pages and Screens. The "Average engagement time" column will show you data for each URL. For pages per session, look for Views per Session or Views per User. If these metrics aren’t visible, you can customize your report to include them.
Adding a secondary dimension like Device category can be particularly insightful. For instance, if mobile users show significantly lower engagement times, it might indicate layout or performance issues that need attention. Low engagement times often point to technical problems or content that doesn’t resonate, both of which can hurt your SEO efforts.
Lastly, you can dig deeper into user behavior by tracking scroll depth and other interactions.
Measuring Scroll Depth and User Interactions
By default, GA4’s scroll tracking fires when users reach about 90% of a page. For more detailed insights - like tracking when users hit 25%, 50%, or 75% - you’ll need to set up a custom solution using Google Tag Manager (GTM). Start by disabling GA4’s default scroll tracking under Admin > Data Streams > Web Stream > Enhanced Measurement and toggling off "Scrolls".
In GTM, enable variables like Scroll Depth Threshold, Scroll Depth Units, and Scroll Direction. Then, create a new "Scroll Depth" trigger by selecting "Vertical Scroll Depths", specifying percentages (e.g., 25, 50, 75, 90), and setting up a GA4 event tag. Name the event scroll_depth, add a parameter called percent_scrolled with the value {{Scroll Depth Threshold}}, and register this parameter as a Custom Dimension in GA4 under "Custom definitions" [31,32].
"GA4's 'built-in scroll event' triggers when a user has scrolled through approximately 90% of the page – but you most likely want to know more than that, such as how many users scrolled through 50% or even 25% of the page."
– Vahan Petrosyan, Director of Technology, Search Engine Journal
Healthy scroll patterns generally show that 80–90% of users reach the 25% mark, while only 20–40% scroll all the way to the bottom.
To analyze this data, use GA4’s Explore section to create a "Free Form" report. Set "Page path" as the row and your scroll parameter as a column. This will help you identify which pages are driving the most engagement. Insights from scroll depth tracking can guide your content strategy, helping you create material that keeps users hooked and improves overall SEO performance. This process often begins with selecting the right keyword research tools to identify high-intent topics.
How to Interpret Engagement Data for SEO
Once you’ve gathered engagement data, the next step is figuring out how to use it to improve your SEO efforts. Numbers alone won’t guide you; they need context and analysis. Start by understanding your current performance levels and how key metrics interact. From there, set benchmarks that reflect your current state, helping you pinpoint areas that need improvement.
Setting Benchmarks for Engagement Metrics
Benchmarks are your baseline - they show where you’re starting, not where you want to end up. Nathan Gotch, CEO of Rankability, puts it simply:
"A benchmark is where you stand right now with specific SEO KPIs. That benchmark is your starting point. In short, benchmarks are NOT KPIs".
Last month’s data is often the best place to start, as it reflects your most recent performance. Avoid relying on older data that might not align with your site’s current conditions. Comparing your performance to industry standards can also help you see where you stand.
Here’s a quick guide to engagement benchmarks:
- Engagement rate: 70% or higher is excellent, 60%–69% is solid, 50%–59% is average, and below 50% signals potential issues.
- Pages per session: Aim for 2.0–4.0.
- Bounce rate: Stay below 40%; anything over 60% may need attention.
Drill down further by segmenting your data by traffic source, page type, and device category. For example, organic search traffic often has engagement rates of 65% or more, while paid social traffic tends to range between 50% and 60% due to its broader targeting. Context matters too - blog posts might naturally have higher bounce rates (60%–80%) because users often leave after finding their answer. But a high bounce rate on a checkout page? That’s a red flag.
To track long-term trends, use year-over-year (YoY) comparisons, which help you avoid seasonal distortions. Analyze your top 25 pages individually to see what’s working and apply those insights to underperforming content. For technical or long-form content, consider extending Google Analytics 4’s default 10-second engagement timer to 30 or 60 seconds to better capture meaningful interactions.
Using Multiple Metrics to Assess SEO Performance
Looking at metrics in isolation can be misleading. Combining them often reveals deeper insights about user behavior and content performance. For example, if your click-through rate (CTR) is high but your engagement rate is low, your SERP snippet might be overpromising, leaving users disappointed when they land on the page.
Other combinations can also highlight issues:
- High pages per session + low session duration: Users may be clicking around without finding what they need, which could point to navigation problems or content gaps.
- High scroll depth + low engagement time: Visitors might be skimming rather than reading, suggesting a need for better formatting or more engaging visuals.
As Ufuk Öncüler from 618media explains:
"Engagement metrics are not just numbers; they are reflections of how well a website meets the needs and interests of its visitors".
Behavioral signals like these are crucial for SEO. Google’s NavBoost system, for instance, uses engagement patterns to decide which sites are relevant for specific keywords. Julie Kalita, SEO Specialist at Workshop Digital, adds:
"NavBoost helps Google determine which sites are relevant enough to rank for a given keyword, therefore less engagement could turn into less visibility and traffic from searches".
When reviewing your data, look for patterns across different dimensions. For instance, if organic traffic consistently meets benchmarks but paid traffic doesn’t, it might point to targeting issues or landing page relevance problems. Prioritizing optimization for high-traffic pages with low engagement can yield significant results.
| Metric Combination | Indicator | Implication |
|---|---|---|
| CTR + Engagement Rate | High CTR / Low Engagement | SERP snippet may mislead; content isn’t matching user expectations |
| Pages per Session + Duration | High Pages / Low Duration | Users may feel lost or frustrated; review navigation and content structure |
| Scroll Depth + Engagement Time | High Scroll / Low Time | Visitors might be skimming; improve formatting and visuals |
| Bounce Rate + Dwell Time | High Bounce / Short Dwell | Likely a mismatch between user intent and content |
| Engagement Rate + Conversion Rate | High Engagement / Low Conversion | Content is engaging, but calls-to-action might need work |
Conclusion: Getting Started with Engagement Metrics
Tracking engagement metrics is a key step toward improving your SEO outcomes. Start by setting up Google Analytics 4 to monitor user behavior on your site and Google Search Console to track pre-click data like impressions and click-through rates. These tools provide the groundwork for understanding your audience and refining your strategy.
Consistency is critical. Establish a regular reporting schedule: review organic sessions and clicks in GSC weekly, analyze metrics like engagement rate and Core Web Vitals monthly, and compare year-over-year traffic quarterly. This approach helps you identify trends early without getting bogged down by daily fluctuations. Pay particular attention to mid-ranking keywords with high impressions - small updates to these pages can lead to noticeable traffic growth.
To take your analysis further, combine insights from multiple data sources. Cross-referencing tools can uncover discrepancies, which often reveal valuable opportunities for deeper investigation. As Jonathan Schwartz, CEO & Co-Founder of Bullseye Strategy, puts it:
"Relying on a single SEO platform is like trying to navigate a city with one street view - you'll get somewhere, but you won't see the full picture".
For additional support, the Top SEO Marketing Directory (https://marketingseodirectory.com) offers a curated list of tools and expert advice tailored to your needs. This resource aligns with the strategies discussed, making it easier to find the right solutions for your business.
The data speaks volumes: engaged users are 23% more likely to make a purchase, and the top three organic search results capture over 68.7% of all clicks. By focusing on engagement metrics, you can directly influence these outcomes. Start small, track data regularly, and use those insights to guide your optimizations. Over time, this approach will lead to noticeable improvements in both user satisfaction and search rankings.
FAQs
Which engagement metrics matter most for SEO?
When it comes to SEO, engagement metrics are like a window into how users interact with your website and how effective your content is. Some of the key metrics to keep an eye on include:
- Session duration: This shows how long visitors stay on your site, which can indicate how engaging or helpful your content is.
- Pages per session: This tracks how many pages a user views during a single visit, reflecting how well your site encourages exploration.
- Bounce rate: A high bounce rate means visitors leave after viewing just one page, which might signal issues with content or user experience.
- Click-through rate (CTR): This measures how often people click on your site after seeing it in search results, showing how appealing your titles and descriptions are.
- Scroll depth: This tells you how far users scroll on a page, offering clues about content engagement.
- Time on page: The amount of time users spend on a specific page, which can highlight how relevant or interesting your content is.
These metrics not only help search engines gauge your site's relevance and user satisfaction but also give you actionable insights to fine-tune your SEO strategy and improve rankings.
How do I track engagement rate and bounce rate in GA4?
In GA4, the engagement rate measures the percentage of sessions where users stay on your site for more than 10 seconds, trigger at least one conversion event, or view two or more pages. On the flip side, the bounce rate represents the percentage of sessions that don’t meet these criteria, essentially showing non-engaged visits. You can find both metrics in GA4’s standard reports or dive deeper by customizing exploration reports for a more detailed analysis.
What should I do if GSC shows high impressions but low CTR?
If your Google Search Console (GSC) data reveals high impressions but a low click-through rate (CTR), it’s time to refine your search snippets to draw in more clicks. Start by enhancing your page titles and meta descriptions - make them engaging and directly relevant to the searcher’s intent. Take a closer look at the queries and pages with poor CTR. Are the snippets unappealing? Does the content fail to match what users are looking for? Address these gaps by adjusting your content and metadata to better meet user expectations and encourage clicks.