If you're looking to improve your website's performance and rankings, Core Web Vitals testing tools are essential. These tools measure key metrics like Largest Contentful Paint (LCP), Interaction to Next Paint (INP), and Cumulative Layout Shift (CLS), which directly impact user experience and SEO. Here's a quick look at the top free tools:
- Google PageSpeed Insights: Combines real-world user data with lab simulations, offering actionable recommendations for both mobile and desktop performance.
- GTmetrix: Provides detailed performance breakdowns, including waterfall charts, with a free plan for basic testing.
- DebugBear Free Checker: Focuses on technical insights, combining lab data with long-term performance tracking.
- RUMvision: Uses anonymized user data to create simple, template-based performance reports and competitive benchmarks.
- Waterfaller: Turns performance issues into actionable tasks for developers, integrating directly with Trello.
Quick Comparison
| Tool | Data Type | Key Features | Best For | Limitations |
|---|---|---|---|---|
| Google PageSpeed Insights | Field + Lab | Actionable tips, mobile/desktop reports | Beginners | Limited to CrUX-eligible sites |
| GTmetrix | Lab | Waterfall charts, trend tracking | Detailed analysis | Limited free tests/month |
| DebugBear | Lab | Developer-focused, long-term tracking | Technical teams | Lab data only |
| RUMvision | Field | Competitive benchmarks, template-based insights | Quick overviews | Limited free features |
| Waterfaller | Lab | Developer tasks, Trello integration | Agile workflows | Requires technical expertise |
Testing your site regularly with these tools can help you fix performance issues, improve user experience, and boost your search rankings. Each tool has unique strengths, so choose based on your specific needs.
The Easiest Way To Check Core Web Vitals on ANY Website
Google PageSpeed Insights
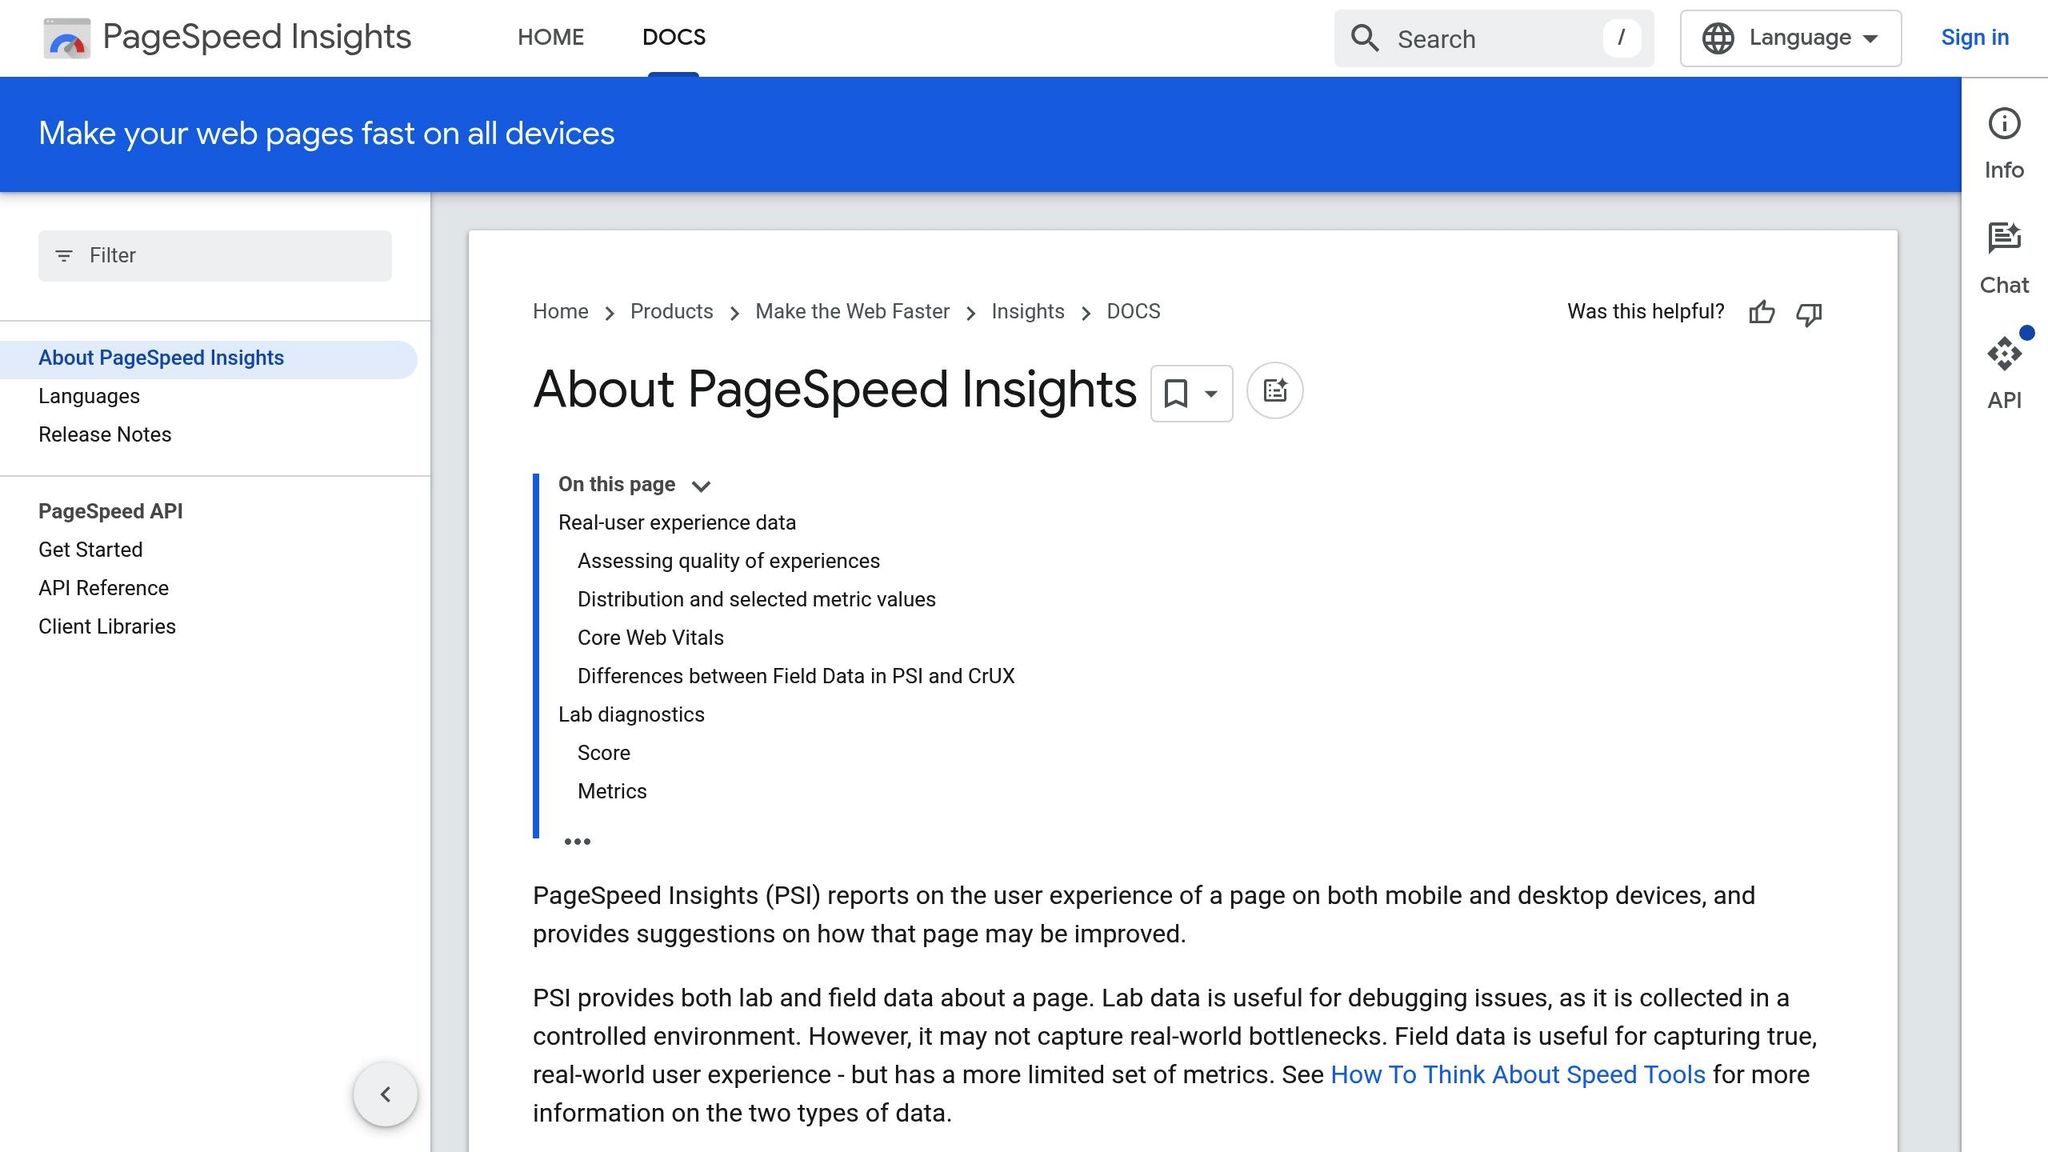
Google PageSpeed Insights is one of the most trusted tools for evaluating Core Web Vitals. Developed by Google, it uses the same performance metrics that directly influence search rankings, making it a go-to resource for website owners looking to improve their site's performance.
What sets PageSpeed Insights apart is its dual approach to data: it provides both field data and lab data to give you a well-rounded view of your website's performance. Field data is collected from real users through the Chrome User Experience Report, reflecting 28 days of actual user interactions. On the other hand, lab data simulates typical browsing conditions to evaluate performance in a controlled environment. If you notice a mismatch - like great lab scores but poor field data - it could indicate that your site performs differently in real-world conditions compared to testing scenarios.
Additionally, the tool measures Core Web Vitals metrics that impact search rankings: Largest Contentful Paint (LCP), Cumulative Layout Shift (CLS), and Interaction to Next Paint (INP). Since these metrics are part of Google's ranking system, the scores you receive can have a direct effect on your site's visibility in search results.
Getting Practical Recommendations
PageSpeed Insights doesn't just show performance metrics - it also provides clear, actionable suggestions for improvement. These are grouped into two sections: Opportunities and Diagnostics.
- The Opportunities section highlights ways to reduce load times and even estimates the potential time savings.
- The Diagnostics section points out additional areas that could use fine-tuning, such as inefficient code or unoptimized resources.
For instance, if your LCP score is suffering due to large, unoptimized images, the tool might suggest compressing those images or deferring offscreen content. These tailored tips make it easier to address specific performance issues.
Field Data and Mobile vs. Desktop Insights
Keep in mind that field data is aggregated over a 28-day period, so any changes you make to optimize your site may take time to show up in the results. This means you’ll need to approach your improvements with patience and a long-term perspective.
Another advantage of PageSpeed Insights is its ability to generate separate performance reports for mobile and desktop platforms. This is especially useful for U.S. audiences, where mobile traffic often dominates. Since mobile and desktop scores can vary significantly, these reports help you decide which platform needs more immediate attention.
Because PageSpeed Insights is free and directly tied to Google's ranking algorithms, it's an invaluable tool for anyone serious about improving their site's SEO and user experience. The metrics it provides align perfectly with what Google considers during rankings, making it an essential first step in testing Core Web Vitals. In the next section, we’ll see how this tool compares to other free options for evaluating Core Web Vitals.
GTmetrix
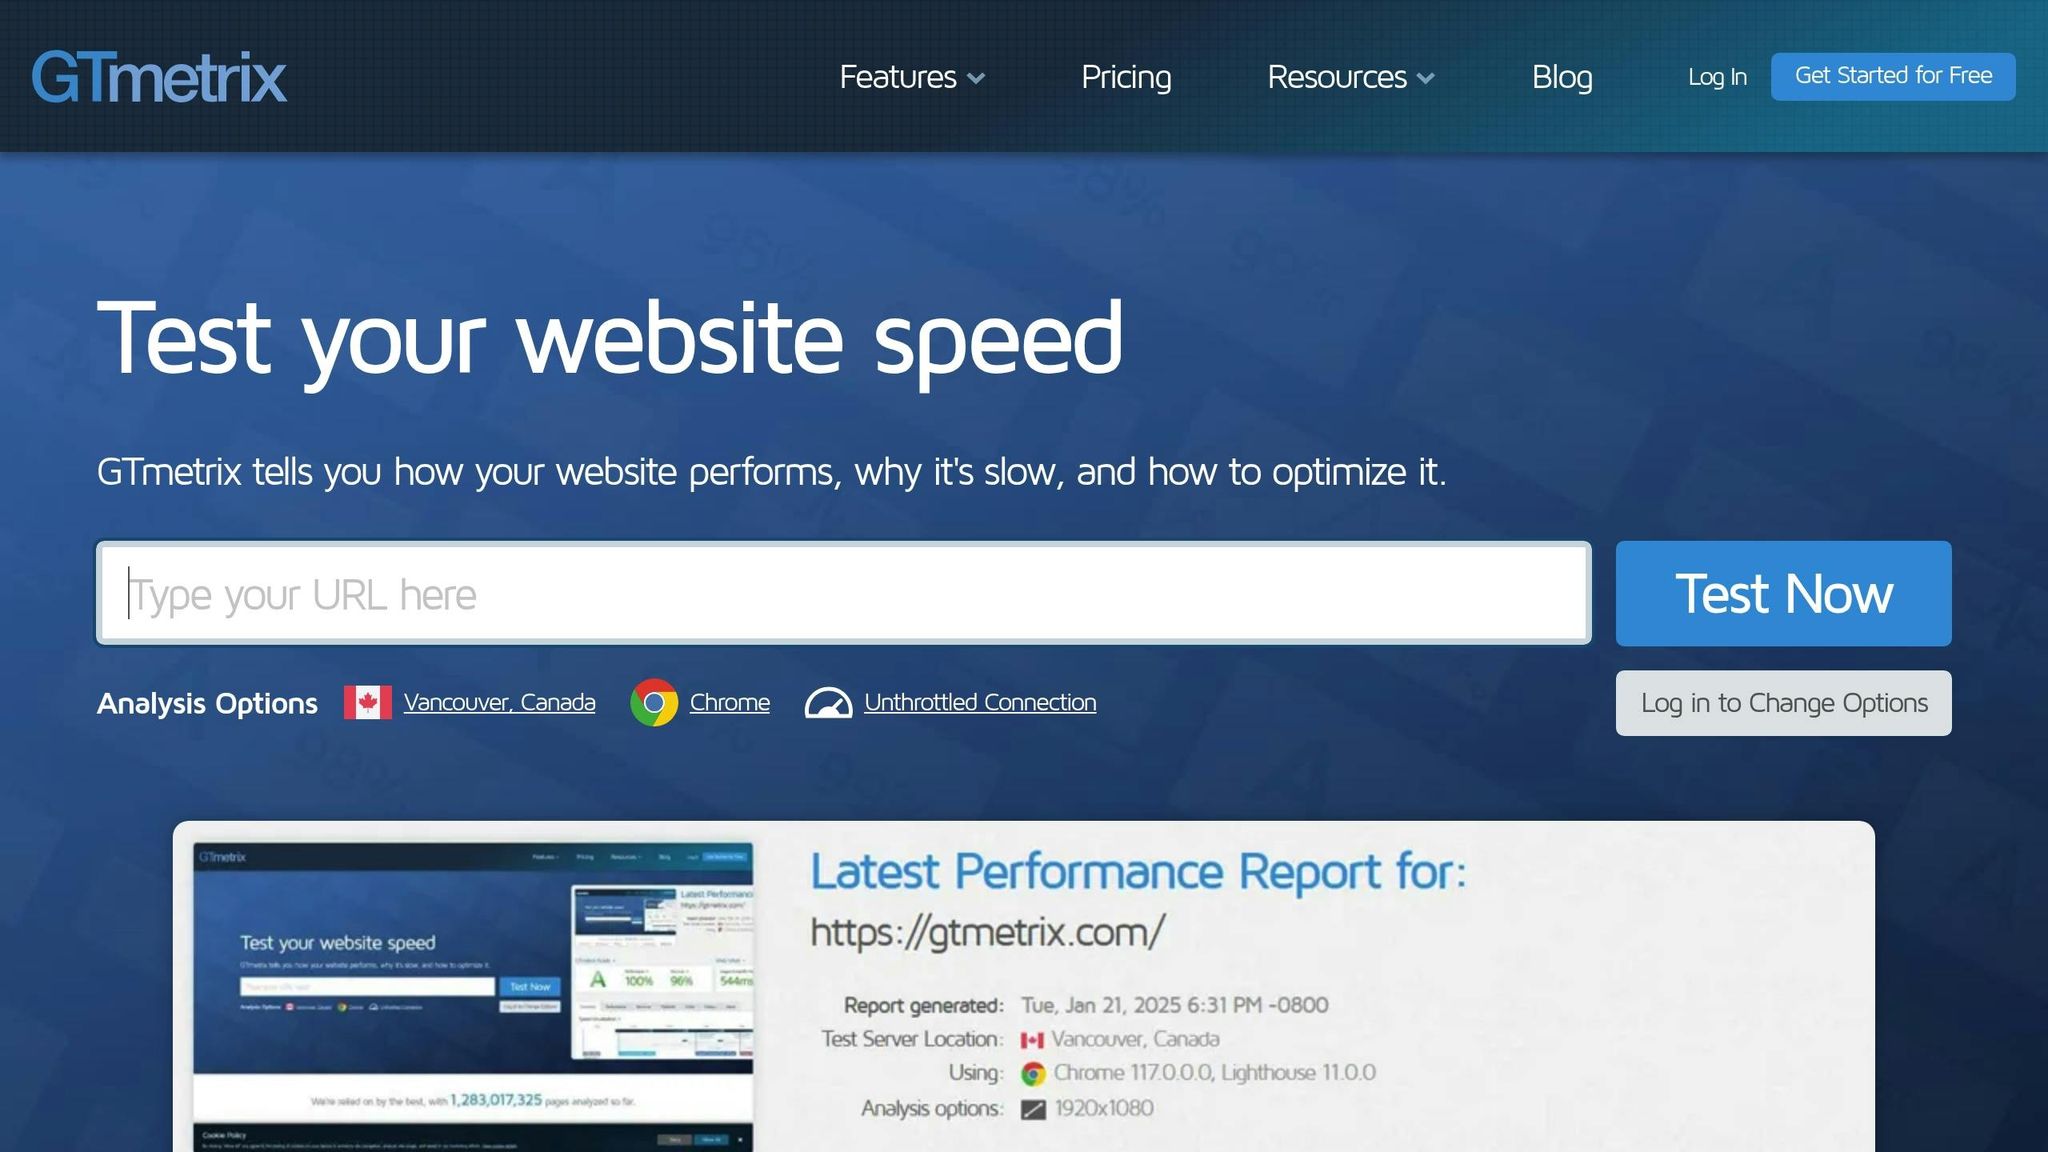
GTmetrix is a popular performance testing tool, analyzing over 430,000 URLs daily to help website owners fine-tune their Core Web Vitals scores. With both free and paid plans, it caters to businesses of all sizes, offering flexibility based on your specific needs.
The free Basic plan allows up to 5 tests per month for six months, measuring key metrics like Largest Contentful Paint (LCP) and Cumulative Layout Shift (CLS) with detailed insights. This automated monitoring feature helps track performance trends over time, eliminating the need for manual testing.
Visual Performance Analysis and Monitoring
GTmetrix provides waterfall charts that visually map out how each element on your website loads. These charts are invaluable for identifying bottlenecks and understanding which resources are slowing down your site, directly affecting your Core Web Vitals.
The free plan supports monitoring for one URL and offers flexible testing schedules - daily, weekly, or monthly. However, data retention is capped at 1 week, so exporting critical results promptly is essential for long-term tracking and analysis.
Location Testing and Limitations
With 7 test locations available on the free plan, GTmetrix enables geographic testing, which is particularly useful for U.S.-based websites. However, mobile testing is only available with GTmetrix PRO, and if you need to monitor multiple websites or require hourly testing, upgrading to a paid plan is necessary. Paid plans start at $10 per month when billed annually.
Real-World Impact and User Feedback
GTmetrix's usefulness is reflected in testimonials from industry professionals. Mike Andreasen, Chief Performance Engineer, highlights its alert system:
"If a metric has gone above a certain threshold, we can get an alert so we can be proactive for our clients - GTmetrix helps us find performance problems before Google notices!"
Irwin Hau, Founder of Chromatix Web Design, also praises the tool:
"GTmetrix gives us tangible data, which is vital for clients and boards to understand the need for digital optimization."
Making the Most of the Free Plan
To get the best out of GTmetrix's free plan, prioritize testing your most critical pages during peak traffic times. With only 5 tests per month, use them strategically - test after deploying significant updates or during different times of the day to capture performance variations. Since the free plan retains data for just one week, document your findings promptly to track progress over time.
For businesses focused on improving their Core Web Vitals, GTmetrix offers a solid starting point for identifying performance issues. However, the lack of mobile testing in the free tier may require pairing it with other tools for a more complete analysis. Next, we’ll compare these tools to help you determine which one meets your needs best.
DebugBear Free Core Web Vitals Checker
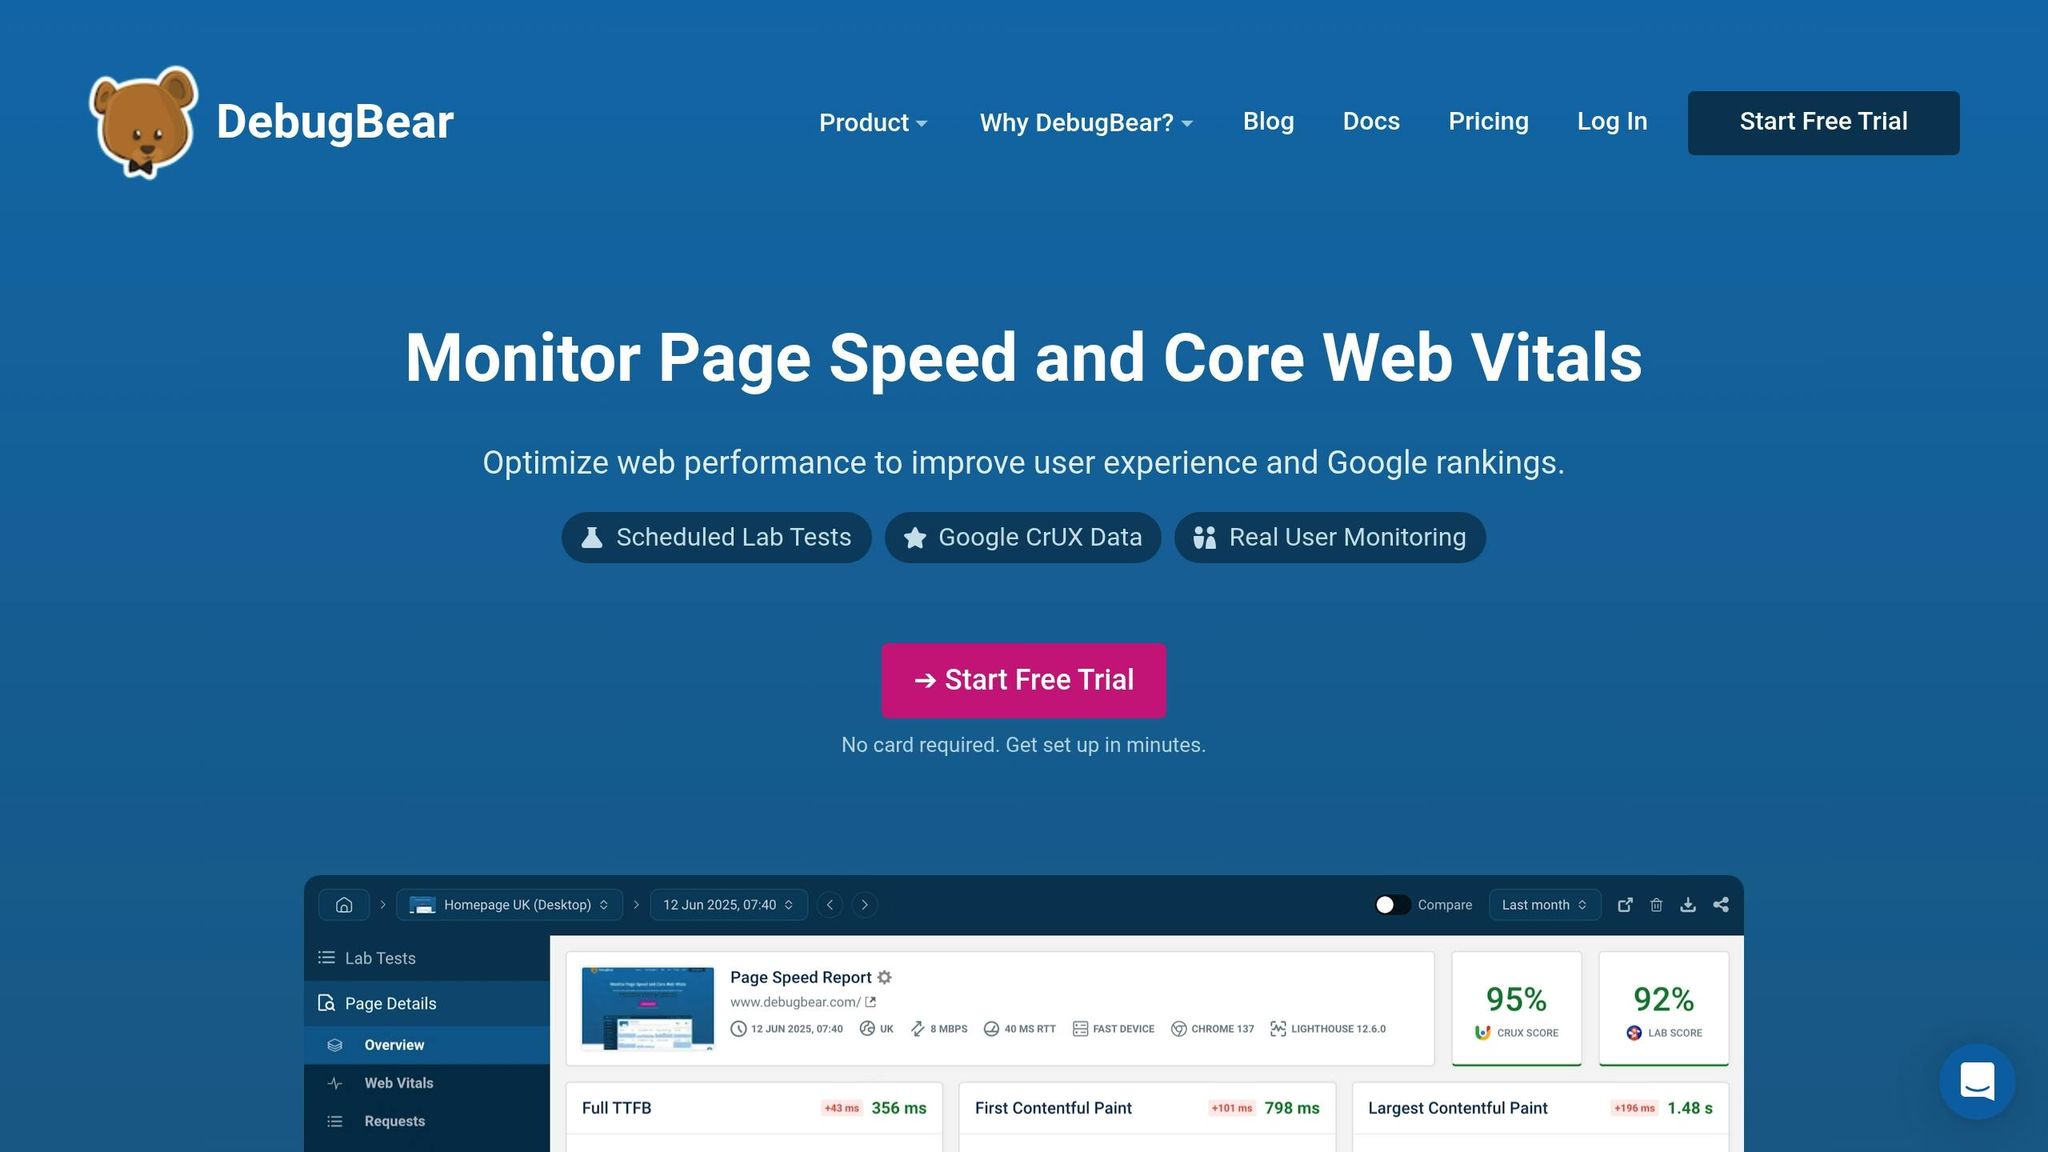
DebugBear takes performance analysis to the next level by blending real user data with lab testing. This means you get insights from both controlled test environments and actual visitor experiences.
Similar to tools like GTmetrix and PageSpeed Insights, DebugBear has its own strengths that make it worth considering. It tracks data from Google's Chrome User Experience Report (CrUX) to help you monitor long-term trends in site performance. Plus, by aggregating performance data over a 28-day window, it makes it easier to spot pages with room for improvement.
Accurate Lab Testing You Can Trust
One of DebugBear's standout features is its approach to lab testing. Instead of relying solely on simulations, it uses real throttled environments to deliver more precise results. Tony Cosentino, Owner at The WP Guy, highlights this benefit:
"DebugBear delivers the best stats for before and after changes in clear detail. It also shows clear and easy to find data for Google's Web Vitals."
In-Depth Metrics and Practical Recommendations
The Web Vitals tab offers a detailed look at performance metrics, combining data from Google's CrUX and lab tests. You can dive into specifics like LCP, CLS, and INP, along with network and CPU metrics, to identify the root causes of performance problems. On top of that, DebugBear provides actionable recommendations to address these issues. Loren McDonald, IT Director, highlights the value of these insights:
"The reporting data is very helpful in pinpointing what causes site speed issues – immediately actionable. It's well above and beyond the info you get from Lighthouse and the performance tests through Chrome."
Continuous Performance Monitoring
DebugBear doesn’t stop at one-time testing. It continuously tracks your page speed, sending alerts if performance drops, so you can address issues before they hurt your search rankings. You can also monitor your progress over time and even measure how you stack up against competitors. After making any optimization, you can trigger a test to see its immediate impact on site speed.
For anyone serious about optimizing Core Web Vitals, DebugBear's free tool offers insights typically found in premium services. With its combination of real user data, precise lab testing, and actionable recommendations, it’s an excellent resource for addressing performance issues that can influence your search engine rankings. Up next, we’ll take a look at another free tool for testing Core Web Vitals.
RUMvision Free Core Web Vitals Checker
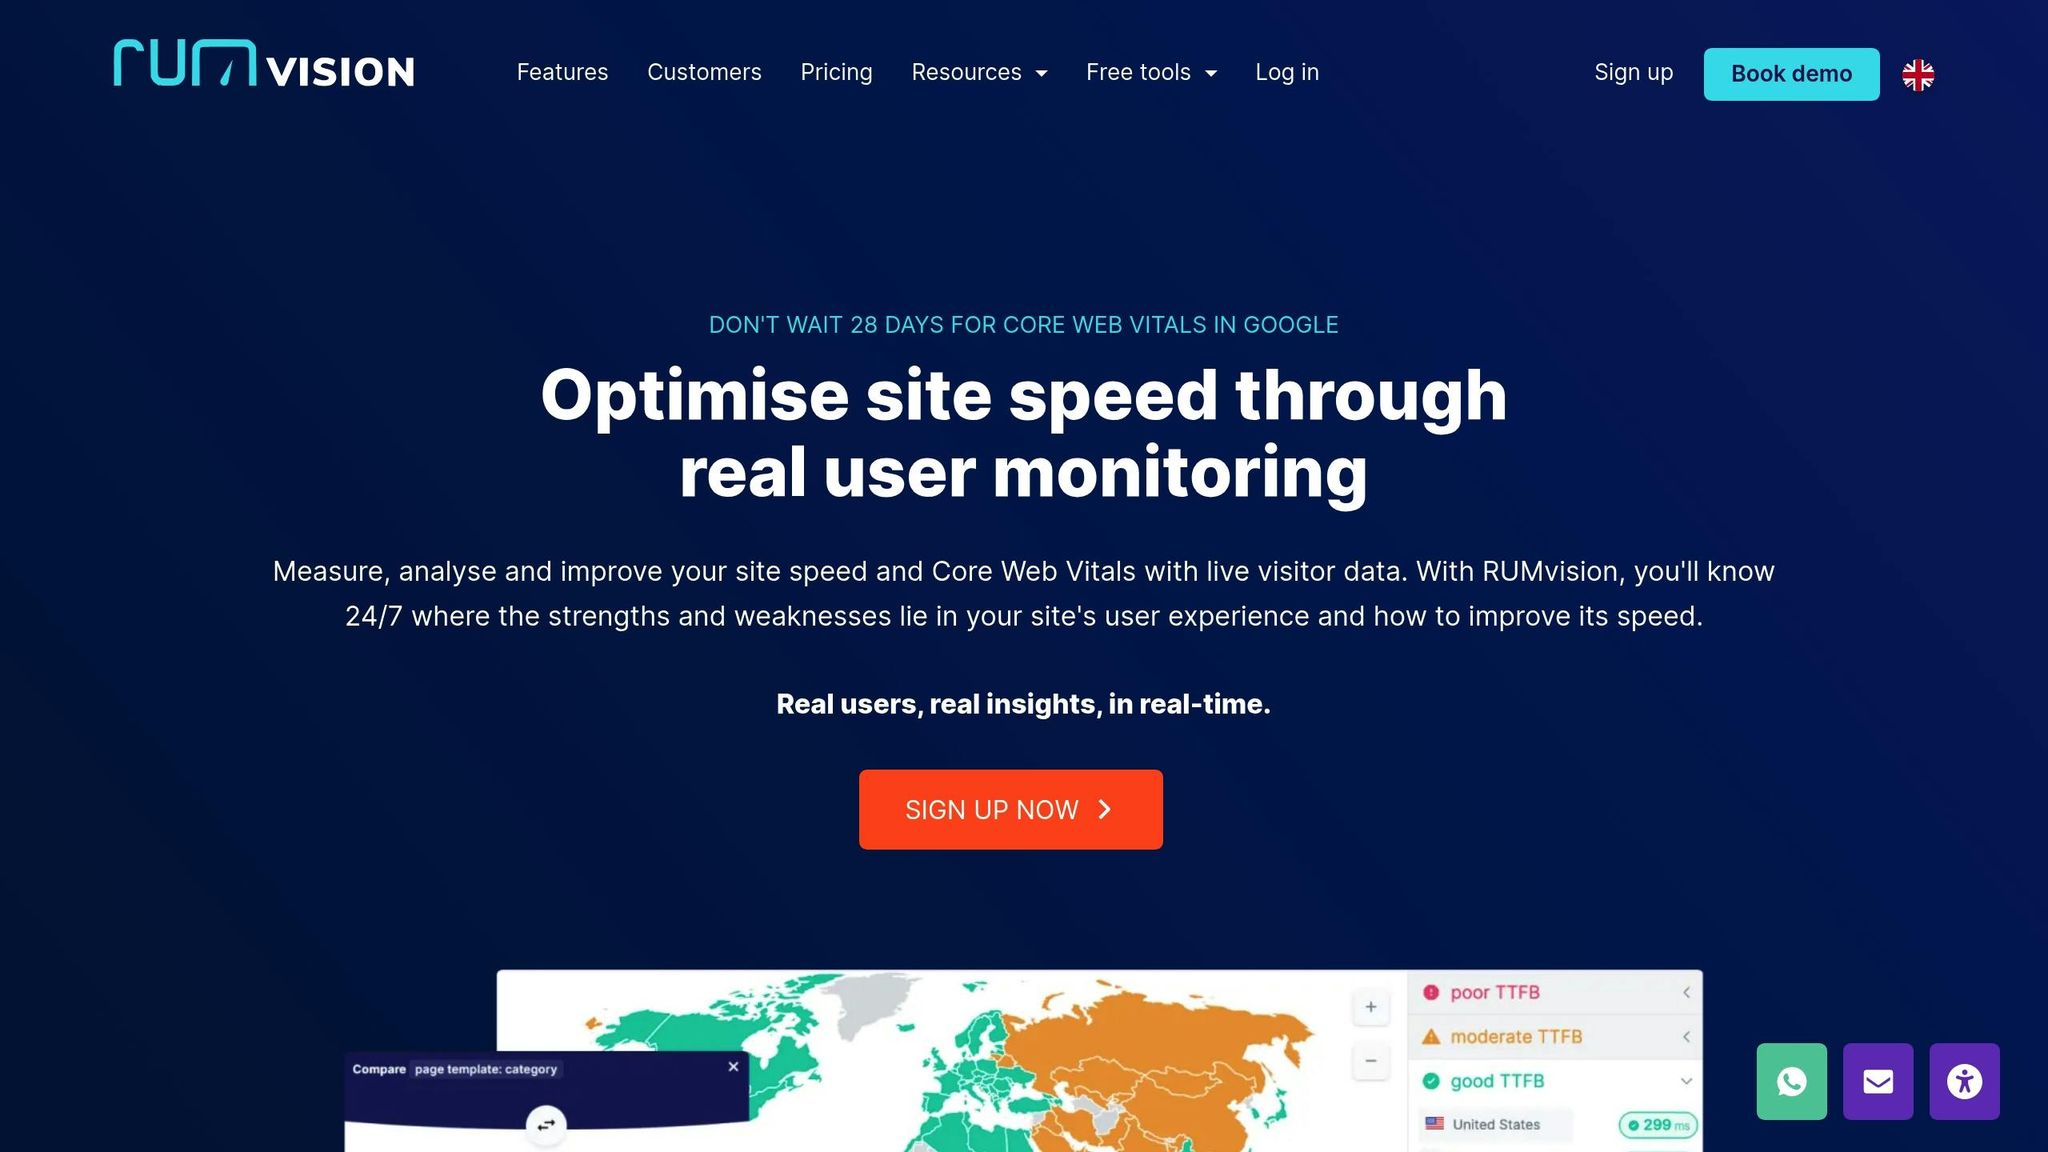
RUMvision, like other top-tier tools, provides actionable insights by leveraging real user data. What sets it apart is its simplicity and accessibility, making Core Web Vitals testing easier for everyone. By tapping into anonymized Chrome data, RUMvision delivers insights into how your website performs for real users, stepping beyond the confines of controlled lab environments.
This tool generates domain-specific Core Web Vitals reports, focusing on key metrics like LCP (Largest Contentful Paint), INP (Interaction to Next Paint), and CLS (Cumulative Layout Shift). These reports give you a clear picture of your site's performance under real-world conditions, setting the stage for a closer look at its standout features.
Template-Based Performance Analysis
RUMvision organizes its Core Web Vitals scores by template, making it easier to pinpoint problem areas. Instead of being overwhelmed by site-wide issues, you can focus on specific templates that need attention. The reports also include a breakdown of pageviews, showing the percentage of users who had good, moderate, or poor experiences based on the selected metric. This structure makes it easier to prioritize optimizations where they matter most.
Real-World Performance Impact
One of RUMvision's strengths is its ability to connect performance improvements with tangible business outcomes. For instance, research shows that improving LCP by 42% can increase the prospect-to-order rate by 60%. Similarly, a 400% boost in INP can cut the bounce rate by 50%, and a 52% faster LCP may drive a 15% revenue increase. These insights underline the direct impact of performance on user behavior and business results.
Competitive Benchmarking and Debugging
RUMvision doesn't just stop at analyzing your site - it also lets you compare your performance against up to 15 competitors. This benchmarking feature helps you see where you stand in the market. Additionally, developers can debug issues at the template level, making it easier to identify and resolve bottlenecks.
Sasha, an SEO Manager at Yoyoba, highlights the tool's practical value:
"Thanks to the great support and direct access to crucial data, we have efficiently improved CWV for many clients. I highly recommend it!"
Ryan, a Fractional CTO consultant at TWNSND, adds:
"RUMvision has been instrumental in identifying performance bottlenecks in unexpected and non-obvious areas - its detailed data segmentation proves highly effective."
Practical Monitoring Approach
RUMvision also excels in proactive performance monitoring. It encourages regular performance checks after each release, helping you catch and address slow-loading pages before they affect user experience. Its Pagespeed UX score provides a quick snapshot of your site's user experience, while detailed metric reports offer the depth needed for targeted optimizations. These features make RUMvision a strong choice for anyone looking to improve Core Web Vitals performance effectively.
sbb-itb-5be333f
Waterfaller
Waterfaller zeroes in on developer workflows by turning Core Web Vitals issues into actionable tasks. Instead of offering broad performance reports, it breaks down Core Web Vitals problems into structured tasks that developers can immediately tackle. This approach connects performance analysis directly to development work, making improvements more efficient.
One of its standout features is the creation of custom audit guidebooks tailored for development teams. These guidebooks go beyond identifying performance issues - they provide solutions in the form of user stories. This makes it easier for developers to understand and implement fixes, bridging the gap between analysis and actionable development steps.
Developer-Centric Task Creation
Waterfaller uses a user story format that fits seamlessly into agile workflows. It creates specific, actionable tasks that developers can act on right away. For instance, instead of simply flagging slow server response times, Waterfaller might produce a user story like: "As a developer, I want the root document server response time to be less than 500ms to improve Core Web Vitals". This format not only explains what needs to be done but also ties the task to broader performance goals, making it clear why it matters.
Trello Integration for Streamlined Workflow
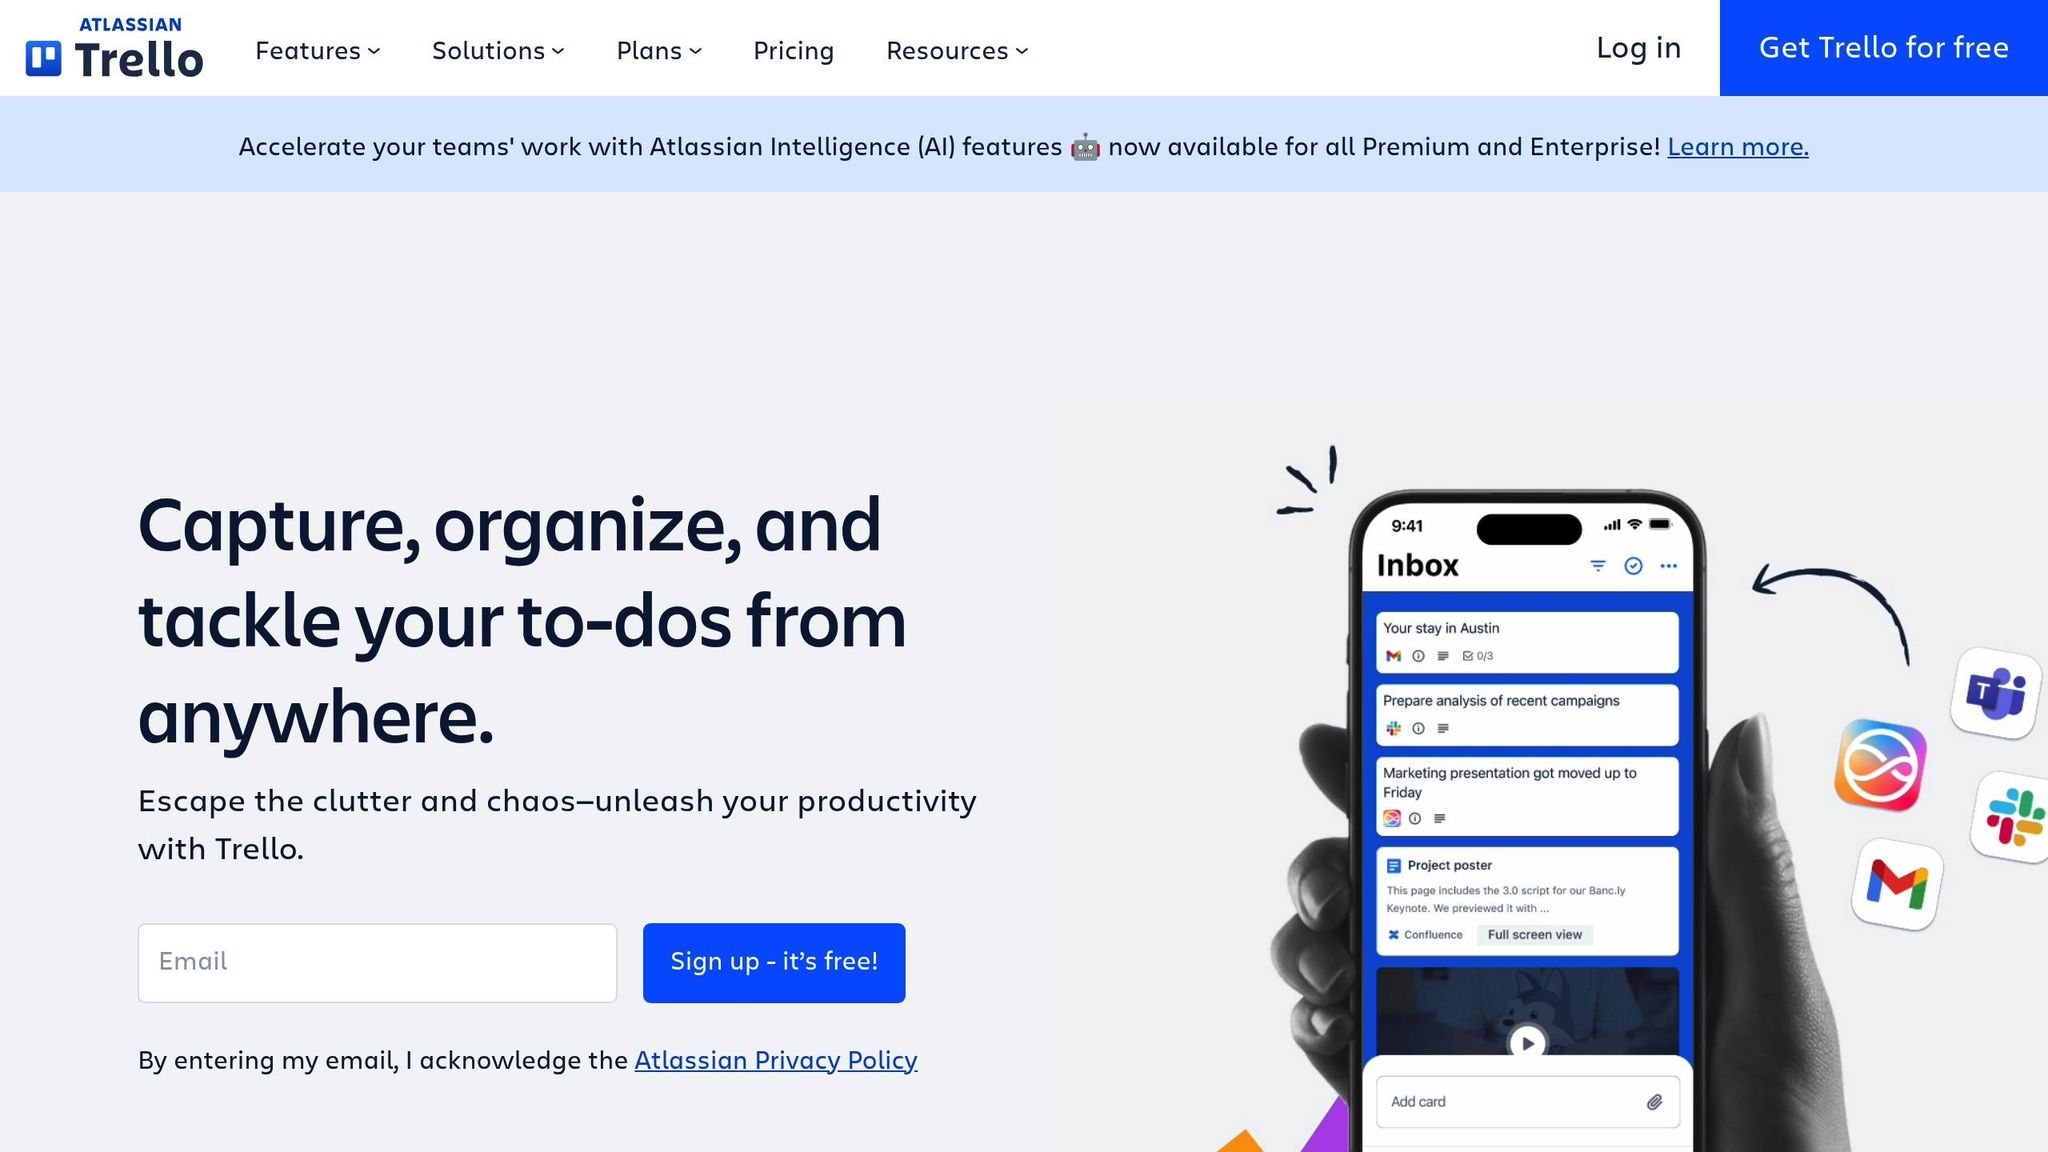
What sets Waterfaller apart is its direct integration with Trello. Once an audit guidebook is ready, teams can send tasks straight to their Trello boards. This integration allows teams to prioritize tasks, assign them to specific team members, set deadlines, and track progress - all within their existing project management system. By connecting performance insights directly to task management, Waterfaller ensures that identified issues quickly translate into action.
A Targeted Approach to Problem-Solving
Waterfaller’s strength lies in its focus on actionable insights. Instead of overwhelming teams with dense performance data, it delivers clear, practical solutions tailored for developers. This approach helps teams improve their Core Web Vitals scores without getting bogged down in unnecessary analysis. By turning complex data into actionable tasks and integrating seamlessly into sprint planning, Waterfaller ensures that performance optimization becomes a natural part of the development process.
Free Core Web Vitals Tools Comparison
Picking the right Core Web Vitals tool comes down to your specific needs, level of expertise, and workflow. Each tool offers its own strengths and trade-offs, primarily depending on the type of data they provide. Here's the difference: field data reflects real user experiences over a 28-day period, while lab data delivers simulated results instantly.
Since optimizing Core Web Vitals is key for both user satisfaction and SEO, this comparison can help you find the right tool to match your website's performance goals. Below is a quick breakdown of the features and limitations of popular tools.
| Tool | Data Type | Key Strengths | Ideal For | Limitations |
|---|---|---|---|---|
| Google PageSpeed Insights | Field + Lab | Clear, actionable reports | Quick checks, beginners | CrUX data only for eligible sites |
| GTmetrix | Lab | Detailed performance breakdowns with waterfall charts | Comprehensive analysis | Limited features in the free plan |
| DebugBear Free Checker | Lab | Developer-focused insights | Technical teams | Only provides lab data |
| RUMvision Free Checker | Lab | One-click reporting with an easy-to-use interface | Quick performance snapshots | Limited free features |
| Waterfaller | Lab | Turns performance issues into Trello tasks | Development workflows | Requires technical expertise |
Key Takeaways
- Google PageSpeed Insights: Combines field and lab data into straightforward reports with actionable recommendations. Perfect for quick assessments and users new to Core Web Vitals.
- GTmetrix: Offers a detailed breakdown of performance metrics, including waterfall charts, making it a strong choice for in-depth analysis.
- DebugBear: Tailored for developers, this tool focuses on technical Core Web Vitals insights.
- RUMvision: Ideal for users who want fast, one-click reports with minimal setup.
- Waterfaller: Integrates performance data into Trello, making it great for teams managing development workflows, though it does require more technical knowledge.
Why This Matters
Did you know that 53% of mobile users leave a page if it takes longer than three seconds to load? Even a one-second delay can slash conversion rates by 20%. These stats highlight how critical it is to pick a tool that helps you monitor and improve your site's performance effectively.
Each tool shines in different scenarios. If you're after quick, beginner-friendly insights, Google PageSpeed Insights is a solid choice. For teams needing detailed reports, GTmetrix delivers. Development teams working on sprints may find Waterfaller's task-oriented features especially useful. Meanwhile, if you need instant results, RUMvision offers a simple, user-friendly solution.
Top SEO Marketing Directory Resource
The free Core Web Vitals tools mentioned earlier provide great insights, but figuring out the right combination of solutions can be tricky. That’s where the Top SEO Marketing Directory comes in. It’s a carefully curated collection of free and premium technical SEO tools designed specifically to address Core Web Vitals.
This directory goes beyond standard performance testing. It includes tools for website auditing, mobile-friendliness checks, and structured data validation - key areas to focus on since Core Web Vitals officially became ranking factors in June 2021.
Why does this matter? Because improving load times by just 100 milliseconds can increase conversion rates by 1%. That’s why the directory emphasizes technical SEO tools that cover everything from in-depth performance analysis to mobile optimization and full-scale website audits.
For businesses that lack in-house expertise or deal with complex e-commerce setups, the directory also features SEO agencies that specialize in Core Web Vitals. This makes it an excellent resource for outsourcing expertise when needed.
One standout feature of the directory is its comparison tool. It lets you evaluate various solutions side by side, considering factors like the type of data provided, reporting features, and integration capabilities. This makes it easier to build a well-rounded monitoring and optimization strategy.
Whether you’re looking for advanced tools to complement the free options discussed earlier or need specialized solutions for mobile optimization, structured data, or ongoing monitoring, the Top SEO Marketing Directory is a one-stop resource for discovering and comparing technical SEO solutions.
Conclusion
Free Core Web Vitals tools play an important role in improving website performance. They help you track and enhance critical metrics like Largest Contentful Paint (LCP), Cumulative Layout Shift (CLS), and Interaction to Next Paint (INP) without needing to invest in costly monitoring tools.
The secret to maximizing these tools is using a combination of them instead of depending on just one. Each tool offers something different: PageSpeed Insights provides quick diagnostics with real-world user data, DebugBear dives into detailed lab-based analysis, Waterfaller equips developers with actionable audit tasks, and RUMvision focuses on real user monitoring. Together, these tools offer a well-rounded view of your site’s performance, ensuring you catch issues that might slip through the cracks when relying on a single tool.
Regular monitoring is just as important as the initial evaluation. Core Web Vitals scores can change over time due to design updates, new content, or shifts in user behavior. Testing consistently after every update helps you identify and address performance drops early on.
FAQs
How do Core Web Vitals affect my website's SEO and user experience?
Core Web Vitals are essential for your website’s SEO and the experience it offers to users. These metrics zero in on three main areas: how quickly your page loads, how responsive it is to user interactions, and how visually stable the content appears. Google takes these factors seriously when determining search rankings.
Focusing on Core Web Vitals helps you build web pages that load faster, feel smoother, and stay visually consistent. This can lower bounce rates and keep visitors exploring your site longer. Plus, a positive user experience can translate into better rankings, giving your site an edge in competitive search results.
What’s the difference between field data and lab data in Core Web Vitals testing?
Field data captures the actual experiences of users interacting with your site under various real-world conditions, such as different devices and network speeds. It offers a genuine glimpse into how your site performs in everyday scenarios.
Lab data, however, is collected in a controlled setting using simulated devices and environments. This approach is great for pinpointing issues and testing changes, but it doesn’t always mirror the complexities of real-world performance. Both data types play important roles: field data reveals user behavior, while lab data is crucial for diagnosing problems and fine-tuning your site.
What is the best free Core Web Vitals tool for beginners to improve website performance?
Google PageSpeed Insights: A Beginner's Best Friend
If you're just starting to work on improving your website's performance, Google PageSpeed Insights is a fantastic free tool to have in your arsenal. Its intuitive design makes it easy for anyone to navigate, even if you're not a tech expert. Plus, it gives you a detailed breakdown of your site's Core Web Vitals for both mobile and desktop platforms.
What really sets this tool apart is the actionable advice it provides. You'll get clear recommendations on how to fix performance issues, making it especially helpful for those new to website optimization. With its straightforward approach and in-depth metrics, it's a solid first step toward enhancing your site's user experience and boosting its search engine rankings.


