A slow product page directly affects your SEO rankings, user experience, and sales. Google prioritizes fast-loading pages, and delays can lead to higher bounce rates, lower conversions, and reduced revenue. Here's why speed is critical:
- SEO Impact: Google ranks faster pages higher, especially after the March 2026 core update emphasizing Core Web Vitals like LCP (loading speed), INP (responsiveness), and CLS (layout stability).
- User Behavior: Shoppers abandon pages that take over 3 seconds to load, with bounce rates increasing by 32% and conversions dropping by 7% for every second of delay.
- Revenue Loss: Slow pages hurt trust and sales. For instance, a 100ms delay can reduce conversion rates by 3.5%.
To improve speed, focus on optimizing product images, reducing JavaScript bloat, and improving server response times. Tools like Google PageSpeed Insights and Search Console help diagnose and fix issues. Faster pages mean better rankings, happier users, and higher sales.
How Product Page Speed Affects SEO Rankings
Core Web Vitals and Google's Ranking Systems
Core Web Vitals are part of Google's core ranking framework, not a separate scoring mechanism. Google's documentation explains:
"Core Web Vitals are used by Google's ranking systems. Integrated into core ranking; not a separate system." – Google Official Documentation (March 2024)
Achieving a "Good" Core Web Vitals score removes a ranking penalty, but going beyond that doesn’t provide extra SEO advantages. The focus should be on meeting the benchmark rather than chasing perfection. Among the metrics, Largest Contentful Paint (LCP) has the strongest connection to rankings, making the loading speed of your main product image a top priority.
Google relies on real-user data from the Chrome User Experience Report (CrUX), which reflects a 28-day collection period instead of simulated lab scores. If individual product URLs lack sufficient CrUX data, Google defaults to origin-level scores. This means poor performance on high-traffic pages can negatively affect rankings for your entire domain.
And it’s not just about rankings - site speed also impacts how efficiently Google crawls your pages.
How Slow Pages Hurt Crawl Budget and Indexing
Slow-loading pages don’t just affect rankings; they also reduce crawl efficiency. Googlebot operates within a crawl budget, limiting the number of URLs it can process during a session. Slow server response times consume more of this budget, leaving fewer pages crawled per visit. For e-commerce sites with thousands of SKUs, this could mean delays in indexing new products, updates, or pricing.
Redirect chains from past site migrations further add to latency, and when multiplied across thousands of product URLs, the effects can escalate quickly. As Thomas Phillips, Co-Founder and CEO of DTC SEO Agency, explains:
"Slow pages lose rankings before they lose conversions." – Thomas Phillips, DTC SEO Agency
Improving Time to First Byte (TTFB) - keeping it under 600ms - is one of the most effective ways to ensure Googlebot can crawl your catalog more efficiently.
Mobile-First Indexing and What It Means for Product Pages
With mobile-first indexing, Google evaluates the mobile version of your product pages to determine rankings for both mobile and desktop searches. A strong desktop performance won't make up for a poor mobile experience. Considering that over 73% of e-commerce searches happen on mobile, yet only 42% of mobile sites meet all three Core Web Vitals thresholds, many stores are already at a disadvantage.
Google’s crawler simulates typical mobile network conditions when testing pages. As mobile usage continues to dominate, the stakes are higher than ever. A one-second delay in page load time can reduce conversions by 20%, while every 100ms delay causes an 8% drop. The March 2026 core update introduced Interaction to Next Paint (INP) as a key ranking signal, meaning full mobile interactivity now plays a direct role in rankings.
Shopify Speed Optimization: Fix Slow Loading, Improve SEO & Pass Core Web Vitals
How Slow Product Pages Affect User Behavior and Revenue
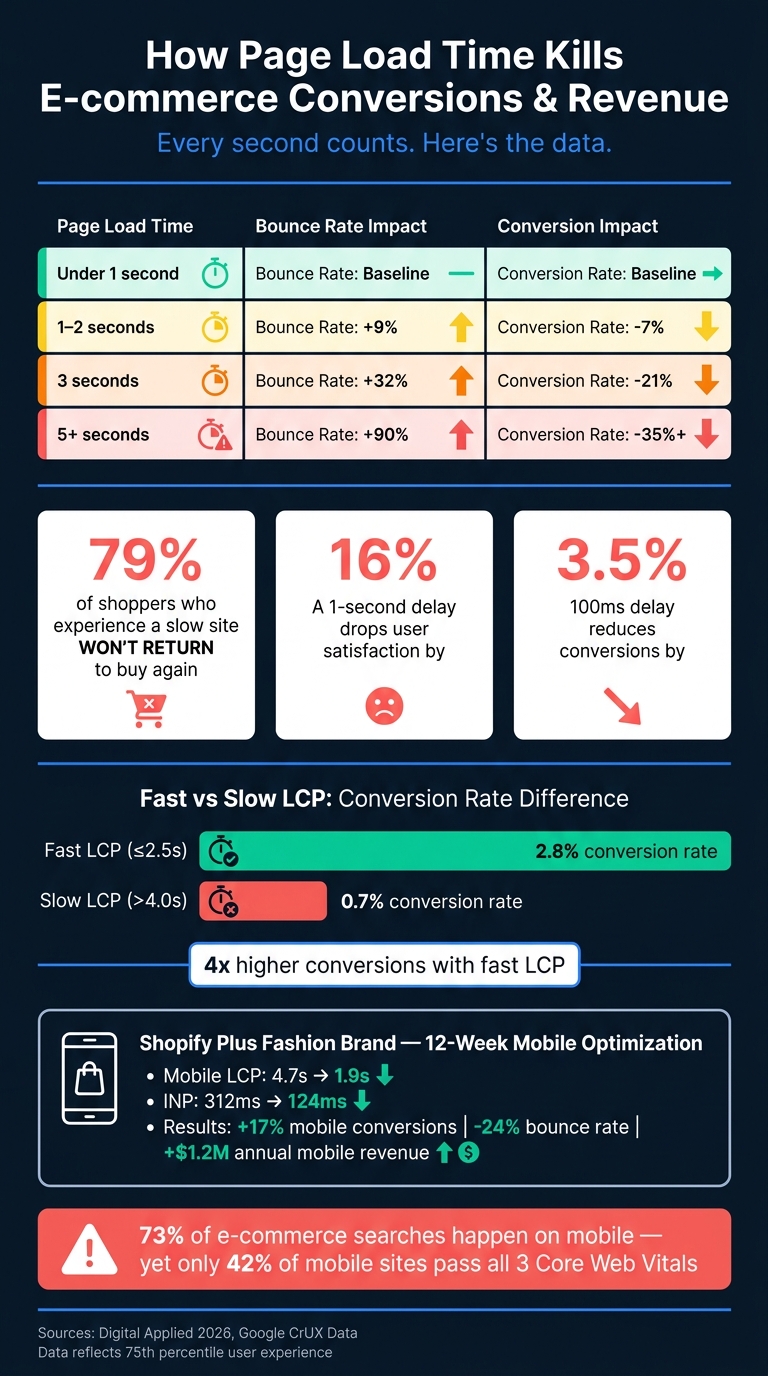
How Page Load Time Kills E-commerce Conversions & Revenue
How Load Time Affects Engagement Metrics
Slow-loading product pages don’t just hurt SEO rankings - they also disrupt user behavior and revenue potential. When pages take too long to load, users lose interest before they even reach the checkout process. This leads to fewer clicks, more early exits, and reduced opportunities for product discovery. In other words, fewer users explore categories or product pages, which means fewer chances to convert them into buyers.
One key issue behind this is Total Blocking Time (TBT). Product pages often have about 15% more TBT than homepages. Why? Features like review widgets, variant selectors, and "Buy Now, Pay Later" tools (e.g., Affirm or Klarna) tend to block the main thread. When this happens, users can’t easily interact with the page - whether it’s tapping "Add to Cart" or switching between product variants - causing frustration and disengagement.
The data makes the impact clear: when load time increases from 1 second to 3 seconds, bounce probability rises by 32%. Stretch that to 5 seconds, and the bounce probability skyrockets by 90%. On mobile, where most U.S. e-commerce traffic now occurs, this problem is even worse. Users abandon slow pages at alarming rates, cutting into both product discovery and revenue opportunities.
This drop in engagement also impacts how users perceive the brand.
How Page Speed Shapes User Trust and Brand Perception
A slow product page doesn’t just annoy customers - it can make them question the reliability of the brand.
"Waiting feels like a reliability problem. If a site cannot load its own product page, why would a shopper trust it with their card details?" – Eknix
Delays during key actions like checkout or cart updates create a sense of uncertainty. Users might start to worry that the transaction won’t go through. On top of that, issues like Cumulative Layout Shift (CLS) - where page elements move unexpectedly - add to the frustration. Accidental taps caused by shifting layouts make the site feel broken, even if it technically functions.
The consequences are serious. Studies show that 79% of shoppers who experience a slow or glitchy site won’t return to buy from that brand again. Plus, for every one-second delay, user satisfaction drops by about 16%. For newer e-commerce brands trying to build trust, these negative experiences can be incredibly damaging - and recovering from that lost trust is a steep uphill battle.
Revenue Impact Across Different Load Time Ranges
The link between page speed and revenue isn’t just theoretical - it’s measurable. A Fast LCP (Largest Contentful Paint) under 2.5 seconds results in a conversion rate of 2.8%, which is four times higher than the 0.7% conversion rate for a Slow LCP over 4 seconds.
Here’s a real-world example: in May 2026, a Shopify Plus fashion brand generating $28 million annually improved its mobile LCP from 4.7 seconds to 1.9 seconds and reduced INP (Interaction to Next Paint) from 312ms to 124ms over a 12-week period. The results? A 17% increase in mobile conversion rates, a 24% reduction in bounce rates, and an additional $1.2 million in annual mobile revenue.
The table below highlights how load time affects key business metrics:
| Page Load Time | Bounce Rate Impact | Conversion Impact |
|---|---|---|
| Under 1 second | Baseline | Baseline |
| 1–2 seconds | +9% | -7% |
| 3 seconds | +32% | -21% |
| 5+ seconds | +90% | -35%+ |
(Source: Digital Applied, 2026)
For smaller and growing stores, these impacts are especially painful, as they’re still trying to build trust with customers. But even for large, established brands, the stakes are high. At scale, even a small slowdown can translate into massive revenue losses.
How to Measure and Diagnose Product Page Speed Problems
Key Metrics to Track for Product Pages
To address speed issues on product pages, you need to start by tracking the right metrics. Google's Core Web Vitals (CWV) are the go-to benchmarks, relying on real-user data from the Chrome User Experience Report (CrUX) to assess performance.
The three Core Web Vitals you should pay attention to are:
- Largest Contentful Paint (LCP): Measures loading speed, typically tied to how quickly the main product image appears.
- Interaction to Next Paint (INP): Replaced First Input Delay (FID) in March 2024 and gauges how fast the page responds to user actions, like clicking "Add to Cart" or selecting a size.
- Cumulative Layout Shift (CLS): Tracks unexpected movements in the layout while the page loads.
In addition to CWV, two other metrics can help diagnose specific issues:
- Time to First Byte (TTFB): Reflects how quickly your server responds. A slow TTFB limits how fast LCP can be.
- Total Blocking Time (TBT): Measures how long JavaScript delays user interactions, offering a lab-based proxy for responsiveness.
Here’s a quick look at the performance thresholds for these metrics:
| Metric | Good | Needs Improvement | Poor |
|---|---|---|---|
| LCP (Loading) | ≤ 2.5s | 2.5s – 4.0s | > 4.0s |
| INP (Responsiveness) | ≤ 200ms | 200ms – 500ms | > 500ms |
| CLS (Visual Stability) | ≤ 0.1 | 0.1 – 0.25 | > 0.25 |
(Source: Google/CrUX thresholds)
It's worth noting that only 66% of websites achieve a good LCP, and just 43% meet the 200ms INP target. If your product pages fall short, it’s time to dig deeper into the root causes using diagnostic tools.
Tools for Testing and Analyzing Page Speed
One of the most accessible tools to start with is Google PageSpeed Insights (PSI). It combines lab data from Lighthouse simulations with real-world data from CrUX. As Jakub Rusniok, Founder of EcomHint, puts it:
"If LCP is bad, customers see a blank screen instead of your products."
PSI's field data reflects user sessions over the past 28 days, helping with rankings, while lab data offers insights for debugging. Or, as another expert explains:
"Field data decides whether you pass, lab tools explain why you fail." – Ecom Design Pro
For more in-depth analysis, Chrome DevTools is invaluable. The Performance panel shows how the LCP element renders, highlights long tasks that block the main thread, and identifies third-party scripts causing delays. The Network panel allows you to block specific scripts to assess their impact, while the Web Vitals Chrome extension provides real-time metrics like LCP, INP, and CLS as you interact with the page.
Another useful resource is Google Search Console's Core Web Vitals report, which groups similar URLs. This makes it easier to identify template-level issues across your product catalog. Instead of testing every single product page, focus on high-traffic product pages, key category pages, and the checkout process to uncover common problems.
Common Speed Problems Found on Product Pages
Once you've gathered the key metrics and used the right tools, it's time to identify common bottlenecks. Product pages often have unique challenges compared to homepages, as they rely heavily on JavaScript for features like variant selectors, review widgets, and cart drawers. This can lead to higher Total Blocking Time (TBT).
One frequent issue is lazy-loading the primary product image. While loading="lazy" works for off-screen images, it can delay LCP by 800ms or more if applied to the main image. For example, in May 2026, 72Technologies optimized a Shopify Plus store by updating image handling and critical CSS, reducing mobile LCP from 4.0 seconds to 1.6 seconds.
Another common culprit is third-party script bloat. Tools like review platforms, live chat widgets, and A/B testing scripts can clog the main thread, pushing INP beyond the 200ms threshold. The "Avoid long main-thread tasks" audit in Lighthouse can help pinpoint the worst offenders.
Lastly, CLS issues are often more pronounced on product pages than on homepages - sometimes up to 14 times worse. This is due to dynamic elements like review widgets, promotional banners, and variant selectors that load after the initial render. To fix this, set explicit width and height attributes for images and reserve space for dynamic elements using min-height to prevent layout shifts.
sbb-itb-5be333f
How to Improve Product Page Speed
Optimizing Product Images and Media Files
Product images can make up a massive chunk of your page weight - typically around 65–80%, or about 2.4MB on average. The quickest way to tackle this is by switching to modern image formats. For example, WebP files are 25–35% smaller than JPEGs, while AVIF files can shrink file sizes by up to 50% compared to JPEGs, all while maintaining excellent visual quality. As Dushyant Patel, an image optimization expert, explains:
"In eCommerce, images are not decoration. They are infrastructure. Product images directly affect page speed, search visibility, and conversion rates."
When it comes to your hero image - often the Largest Contentful Paint (LCP) element - it’s critical to prioritize its loading. Use high-priority and eager loading attributes and preload it with a <link rel="preload"> tag in the <head> section (before your stylesheets). This ensures the browser fetches the image immediately, even before parsing the rest of the page. According to SEO specialist Hardeep Singh:
"Preloading your LCP image is the single highest-impact LCP fix available for the effort involved."
One important tip: don’t combine rel="preload" and loading="lazy" on the same image. These attributes cancel each other out and can actually delay your LCP. Instead, use loading="lazy" for gallery thumbnails and images that appear below the fold. Additionally, only load high-resolution images when users zoom in to reduce the initial page load. For mobile performance, aim to keep individual product images under 200KB.
Reducing JavaScript and Third-Party Script Impact
JavaScript often poses a bigger challenge than images because it can block the main thread, preventing the browser from rendering content or responding to user actions while scripts are being executed. Product pages, in particular, tend to include 10% more JavaScript than homepages, thanks to features like variant selectors, review widgets, and BNPL tools like Affirm or Klarna. On average, Shopify product pages carry around 971KB of unused JavaScript during the initial load.
To address this, start by auditing your scripts using Chrome DevTools. Remove any scripts that aren’t essential. For tools you need - such as chat widgets or review platforms - consider using a facade pattern. This involves showing a lightweight placeholder and only loading the full JavaScript library when users scroll to or interact with that section. Another effective strategy is configuring Google Tag Manager to trigger scripts based on user actions, like scrolling halfway down the page, rather than loading everything upfront. This can cut main-thread blocking time by up to 40%. As a goal, keep the total JavaScript weight on critical product pages under 300KB.
Improving Server Response Times and Mobile Performance
No matter how much you optimize, a slow server can undermine everything. A sluggish server increases Time to First Byte (TTFB), which can negate other improvements. Aim for a TTFB of under 200ms. One of the most effective infrastructure upgrades is implementing a Content Delivery Network (CDN). A CDN reduces TTFB by 60–80% by serving content from edge nodes closer to your customers. This is especially important for Googlebot, which crawls from U.S.-based IP addresses. Using a CDN with U.S. edge nodes ensures fast response times, regardless of your origin server’s location.
On mobile, where 64%+ of global web traffic originates, it’s crucial to design product pages with a mobile-first approach. Google uses the mobile version of your site for indexing and ranking. To improve mobile usability, ensure touch targets are at least 48×48 CSS pixels, set body text to a minimum of 16px, and use sticky "Add to Cart" buttons so the primary call-to-action remains visible as users scroll. Collapsing sections like specifications and reviews into accordions can also reduce excessive scrolling, making the page feel faster on smaller screens.
These strategies set the stage for incorporating speed improvements into your broader SEO efforts.
Making Product Page Speed Part of Your Ongoing SEO Process
Page speed isn’t just a one-time project - it’s something that should be woven into your ongoing SEO efforts, especially when it comes to product pages.
Setting Speed Standards for Product Pages
To keep your site running smoothly, speed optimization has to become part of your regular workflow. Aim for these benchmarks: LCP ≤ 2.5s, INP ≤ 200ms, and CLS ≤ 0.1. These targets ensure your pages load quickly and perform well for most users, even those without blazing-fast internet connections. Remember, Google evaluates performance at the 75th percentile, so it’s about optimizing for the majority of your audience, not just the lucky few.
To avoid performance hiccups, use tools like Lighthouse CI to automate performance tests. These tests can help catch issues before updates or changes go live. For resource budgets, stick to these limits: keep total JavaScript under 300KB and limit individual product images to 400KB. These guidelines align with earlier optimization tips and help maintain a fast user experience.
Once you’ve set these standards, it’s time to focus on tracking and maintaining speed consistently.
Tracking and Maintaining Speed Over Time
Google Search Console’s Core Web Vitals report (found under the Experience tab) is a great starting point for identifying underperforming pages. It organizes URLs by template type, making it easier to spot patterns. However, since CrUX data comes with a 28-day delay, pairing it with Real User Monitoring tools can provide live performance insights. While lab tools like PageSpeed Insights are excellent for debugging, field data is what influences Google’s ranking signals.
Establish a routine to monitor performance and catch regressions early. Here’s a suggested cadence:
| Frequency | Task | Tool |
|---|---|---|
| Weekly | Check crawl errors and Core Web Vitals status changes | Google Search Console |
| Monthly | Track keyword rankings and flag speed regressions | Ahrefs, SEMrush |
| Quarterly | Conduct a technical mini-audit (schema, redirects, third-party scripts) | PageSpeed Insights, Screaming Frog |
| Event-driven | Review immediately after core updates, migrations, or redesigns | Lighthouse, Google Search Console |
Quarterly audits are particularly handy for spotting leftover code from uninstalled apps, which can quietly drag down performance.
Finding Expert Help for Speed Optimization
If your store has over 500 SKUs or your organic traffic has plateaued, you might hit a point where DIY efforts aren’t enough.
"If your store is fighting platform overhead or running on a theme that has been 'optimized' three times and still scores in the 60s on PageSpeed, the architecture is the problem - not the content team." - Jacob Anderson, Logos Web Designs
In such cases, it’s worth seeking out professionals who specialize in your platform - whether that’s Shopify, WooCommerce, or something custom. The right experts will focus on tying speed improvements to revenue outcomes, not just technical scores. A good place to start is the Top SEO Marketing Directory, which lists vetted technical SEO and performance specialists, including those experienced in Core Web Vitals and e-commerce infrastructure.
"A strong ecommerce search engine optimization agency treats product page SEO as a revenue lever - auditing by impact, prioritizing fixes that move money, and tying changes to total business performance." - Sarthak, CommerceV3
Bringing in experts transforms speed optimization from a sporadic effort into a consistent, results-driven strategy.
Conclusion: The Business Case for Faster Product Pages
Product page speed isn't just a technical detail - it’s a major driver of SEO, revenue, and customer trust. Since the March 2026 Google core update, Core Web Vitals have transitioned from being secondary considerations to primary ranking factors. On top of that, AI-powered search tools now evaluate page performance, further reducing the visibility of slow or error-prone pages.
The cost of slow-loading pages is undeniable. A 1-second delay can slash conversions by 7%, while a 3-second load time can drive bounce rates up by 32%. These stats highlight how improving technical performance directly impacts revenue and competitiveness. For instance, Rakuten saw a 33% boost in conversion rates and a 53% increase in revenue per visitor after optimizing Core Web Vitals.
"The businesses who are furthest behind in 2026 are not the ones with weak content strategies, but the ones who have fast competitors and slow websites." - Kashaf, SEO Manager, Keytomic
Currently, only 42% of mobile sites meet all three Core Web Vitals, leaving a significant gap for brands willing to invest in speed. Hitting benchmarks like LCP ≤ 2.5 seconds, INP ≤ 200 milliseconds, and CLS ≤ 0.1 can provide a clear advantage in both organic search rankings and AI-driven discovery.
If you’ve maxed out your internal resources, consider using the Top SEO Marketing Directory to connect with vetted technical SEO experts. These specialists can handle challenges like minimizing JavaScript or optimizing server response times - ensuring every improvement delivers real results. Start optimizing your product pages now to stay ahead of the competition.
FAQs
Which Core Web Vitals matter most on product pages?
When it comes to e-commerce product pages, three metrics play a big role in both user experience and search engine rankings: Largest Contentful Paint (LCP), Interaction to Next Paint (INP), and Cumulative Layout Shift (CLS). Here’s a quick breakdown:
- Largest Contentful Paint (LCP): This measures how quickly the largest visible content on the page loads. For a smooth experience, aim for it to load in under 2.5 seconds.
- Interaction to Next Paint (INP): This focuses on how responsive your page is when users interact with it. Keep this metric at 200 milliseconds or less for optimal performance.
- Cumulative Layout Shift (CLS): This ensures the page's visual elements stay stable as it loads, avoiding unexpected shifts. A score of 0.1 or lower is the target.
These metrics not only help improve user satisfaction but also boost your chances of ranking higher on Google.
Why can slow product pages delay indexing of new SKUs?
When your product pages load slowly, it can impact how quickly they get indexed. Here's why: search engines have a limited crawl budget - essentially, a cap on how many pages they’ll crawl on your site during a session. If your pages take too long to load, fewer URLs get processed. This means crawlers may either spend more time on your existing content or fail to move past the slow-loading pages. As a result, your new product URLs might sit unnoticed for longer periods, delaying their chance to appear in search results.
What are the fastest fixes to improve LCP on mobile product pages?
If you're looking to improve the Largest Contentful Paint (LCP) on mobile product pages, here are a few practical steps to focus on:
- Pinpoint the LCP element: Use tools like Chrome DevTools or Lighthouse to identify which element is contributing to your LCP score.
- Optimize hero images: For hero images, avoid lazy loading by setting
loading="eager", assignfetchpriority="high"to ensure they load quickly, and implementsrcsetfor delivering mobile-optimized versions of the images. - Upgrade image formats: Convert images to modern formats like AVIF or WebP for faster loading and better compression without sacrificing quality.
- Reduce server response time: Speed up Time to First Byte (TTFB) by leveraging edge caching or a Content Delivery Network (CDN) to serve content more quickly.
These steps can make a noticeable difference in improving LCP performance on mobile.