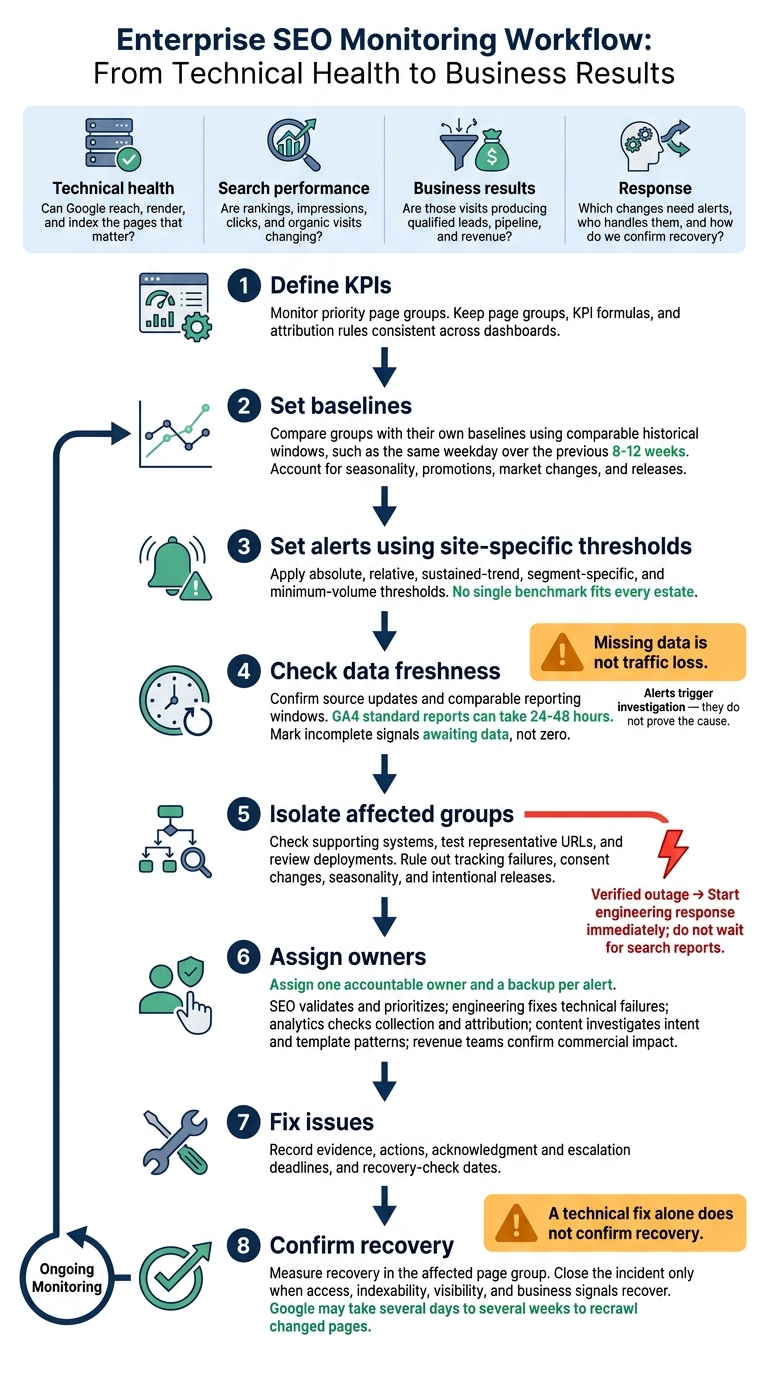
I track enterprise SEO from crawl access to revenue - and check the data before treating a drop as a problem. My starting point: monitor priority page groups, compare them with their own baselines, and assign an owner to each verified issue.
I organize monitoring around 4 checks:
- Technical health: Can Google reach, render, and index the pages that matter?
- Search performance: Are rankings, impressions, clicks, and organic visits changing?
- Business results: Are those visits producing qualified leads, pipeline, and revenue?
- Response: Which changes need alerts, who handles them, and how do we confirm recovery?
Timing matters. GA4 standard reports can take 24-48 hours, so I use live system checks for outages and delayed reports for trends. I also keep page groups, KPI formulas, and attribution rules consistent across dashboards.
My rule: <u>missing data is not traffic loss</u>, and a technical fix alone does not confirm recovery.
Enterprise SEO Monitoring: From KPIs to Confirmed Recovery
How do enterprise SEO dashboards work at scale?
sbb-itb-5be333f
Index Coverage and Crawl Health
Start with access: can Googlebot reach revenue-driving URLs? Report affected URL counts and percentages by priority page group, not sitewide totals. Use these checks and top SEO tools to assign each issue to an owner.
| KPI | Definition | Preferred sources | Monitoring cadence | Responsible teams |
|---|---|---|---|---|
| Priority-page index coverage | Indexed eligible priority URLs ÷ eligible priority inventory × 100 | Search Console Page Indexing, URL Inspection, sitemap inventory | Daily trend; weekly review | SEO and content |
| Crawl error rate | Failed verified Googlebot requests ÷ total verified Googlebot requests × 100 | Server logs, Crawl Stats, uptime monitoring | Near real time; daily review | SEO, platform engineering, SRE |
| Googlebot response time | Average and percentile time to serve verified Googlebot requests | Server logs, application performance monitoring, Crawl Stats | Hourly or daily | SRE and platform engineering |
| Nonpriority crawl share | Requests to designated nonpriority or nonindexable groups ÷ total verified Googlebot requests × 100 | Server logs, URL classification system | Daily or weekly | Technical SEO and engineering |
| Sitemap validity and freshness | Share of sitemap URLs that are valid, canonical, indexable, and recently updated | XML sitemaps, Search Console | Daily for critical sitemaps | SEO and web platform |
Priority-Page Index Coverage and Indexing Time
Calculate priority-page index coverage using a documented inventory with each page’s canonical URL, page group, owner, indexability policy, and sitemap membership. Exclude intentionally nonindexable URLs and duplicate variants. Track submitted vs. indexed trends, exclusions, and counts for “Discovered - currently not indexed” and “Crawled - currently not indexed”. Check each exclusion against its intended policy. A sitemap gap alone does not prove a failure.
Measure time to index from the CMS publication timestamp to the first confirmed indexed observation. Record the first sitemap appearance and first observed crawl to pinpoint delays. Report the median and 90th percentile by page group. Inspect representative and high-value URLs, but don’t treat URL Inspection as a complete enterprise index database.
Crawl Errors, Response Times, and Crawl Use
Verify Googlebot through reverse and forward DNS checks before counting crawl errors. Separate unexpected 5xx responses, DNS failures, connection failures, and timeouts from intentional redirects or intended removals. Chart daily requests, response-code shares, and average and percentile server response times by host and page group.
For nonpriority crawl share, document which URL groups count as nonpriority or nonindexable. Redirects after migrations and recrawls of changing inventory may serve a purpose. Investigate sustained changes against each group’s baseline rather than labeling every non-200 response or repeat request as waste.
Canonical, Robots, Sitemap, and Template Checks
Check for conflicting canonicals, priority URLs canonicalized elsewhere, blocked directories, and robots.txt availability. Review sitemap entries for redirects, failures, noindex, and stale last modified dates. Test representative templates for rendering, links, metadata, JavaScript, and mobile behavior - a 200 response does not prove the page renders correctly.
Track template-level Core Web Vitals field pass rates and disclose missing coverage, since Search Console samples indexed URLs. Use synthetic checks to detect problems promptly and delayed CrUX data to validate real-user performance.
Visibility, Traffic, and Conversion Metrics
Once crawl health is stable, check whether priority pages are gaining visibility, traffic, and conversions.
Ranking Changes and Search Visibility
Top-3, top-10, and top-20 coverage measure the share of tracked eligible keywords ranking in positions 1–3, 1–10, and 1–20. Report percentages, counts, net gains and losses, new queries, dropped queries, and share of voice. Keep the keyword set, location, language, device, engine, and competitor set fixed.
Separate brand from non-brand results. Compare matched 28-day windows and year-over-year periods to account for seasonality. Document how you calculate visibility and share of voice, including any weighting. Search Console average position reflects the best-positioned result across searches; it is not a precise rank for every URL.
Read rankings alongside impressions, clicks, CTR, and SERP-feature presence. Calculate CTR as clicks ÷ impressions × 100. Falling impressions can reflect weaker demand. If rankings stay stable but CTR falls, check search features, titles, and snippets.
Check whether queries lead to the right URLs. Alternating URLs or a page that serves the wrong funnel stage may point to an intent or internal-linking issue, but neither proves cannibalization. Review intent, internal links, and conversion performance before consolidating pages. Escalate only sustained, group-level changes that exceed a minimum volume threshold.
Organic Traffic and Conversion Paths
Move from rankings to sessions and revenue.
Define organic sessions by channel classification, organic users by the acquisition scope you report, and landing-page entrances as sessions that start on a URL or page group. Report engagement rate as engaged sessions ÷ sessions, along with new-versus-returning behavior under the platform’s definitions.
Calculate session conversion rate as sessions with the selected conversion ÷ organic sessions × 100. Report event counts separately. Connect forms, calls, trials, and purchases to CRM-qualified leads, pipeline, and closed revenue. Revenue per organic session = attributed organic revenue ÷ organic sessions. Keep the attribution basis consistent.
| Attribution approach | Best use | Availability and limits |
|---|---|---|
| First-touch | Identify channels that introduced users | Gives no credit to later interactions. |
| Last-touch / last-click | Evaluate the final interaction before conversion | Can undervalue earlier organic research and assisted touches. State how direct traffic is handled. |
| Data-driven | Allocate credit across observed paths | Depends on sufficient data, stable tracking, and model transparency. Report assisted contributions, path length, and conversion lag alongside allocated credit. |
Use attribution models to answer different business questions, not to present one model as correct for every case. Report direct conversions and assisted contributions together. Analyze paths by lead type, product, funnel stage, and customer segment, including conversion lag and path length. When comparing numbers from different models, label the model, lookback window, property, and reporting date.
Reconcile Search Console, GA4, and CRM at the page-group level rather than forcing exact parity. Compare page, landing-page, date, country, device, and campaign data. Do not claim that a query caused revenue.
Page-Group Performance and Business Value
Use page groups to separate demand shifts from sitewide noise.
Assign each eligible URL a stable primary group. Include dimensions for directory, template, category, service, location, language, funnel stage, business unit, and content age. Keep grouping rules fixed during comparisons.
Flag indexed pages without useful traffic, traffic without conversions, and converting groups that are losing visibility. Judge each group by its role and conversion lag. Support content may contribute to assisted conversions or retention rather than direct revenue.
| Reporting layer | Decision supported | Required evidence |
|---|---|---|
| Executive summary | Priorities and investment | Non-brand visibility, qualified leads, pipeline, revenue, revenue per organic session, and major gains or losses |
| Page-group diagnostics | Find affected segments and causes | Eligible/indexed URLs, crawl errors, Core Web Vitals or other experience indicators, impressions, CTR, ranking buckets, entrances, engagement, conversions, and revenue |
| URL-level evidence | Validate and fix issues | URL, canonical, index status, crawl errors, target queries, ranking URLs, impressions, clicks, CTR, conversions, templates, and change history |
Alert Thresholds, Dashboards, and Response Rules
Use page-group baselines to turn performance changes into alerts teams can act on.
Define Alert Conditions and Severity
Build baselines from comparable historical windows, such as the same weekday over the previous 8-12 weeks. Account for seasonality, promotions, market changes, and releases. Apply absolute, relative, sustained-trend, segment-specific, and minimum-volume thresholds. Set thresholds per site; no single benchmark fits every estate. Alerts trigger investigation - they do not prove the cause. Check data freshness within the alert logic before interpreting a decline.
| KPI | Alert condition | Severity | Validation step | Responsible team |
|---|---|---|---|---|
| Availability and server errors | Verified broad production outage or 5xx responses across many hosts or pages | Critical | Check uptime, logs, affected hosts, and deployment timing | Engineering |
| Priority-page discoverability | Priority section blocked by robots.txt or broken canonical implementation across a major template | Critical | Check live directives, canonical targets, sample URLs, and deployments | Engineering with SEO |
| Priority-page index coverage | Sustained decline beyond the segment baseline and minimum affected-URL count | High | Check data freshness; inspect affected and unaffected URLs | SEO |
| Organic conversions | Sustained segment loss exceeding a site-specific relative threshold and minimum volume | High; critical only for verified loss in a high-value page group | Check tracking, traffic, conversion lag, and commercial evidence | SEO, analytics, and revenue |
| Response time and crawl behavior | Sustained template-level deterioration without confirmed broad business impact | Medium | Compare Crawl Stats, logs, and infrastructure changes | Technical SEO and engineering |
| Data freshness | Source update is late or incomplete | Informational / data quality | Check source status and ingestion | Analytics |
Validate before escalating. Confirm data freshness and comparable windows, check supporting systems, and isolate affected segments. Then test representative URLs and review deployments. Rule out tracking failures, consent changes, seasonality, and intentional releases. Mark incomplete signals awaiting data, not zero. For a verified outage, start the engineering response without waiting for search reports.
Route the alerts into dashboards built for each role.
Build Dashboards for Reporting and Diagnosis
| Dashboard | Audience | KPIs | Update needs | Decisions supported |
|---|---|---|---|---|
| Executive | Marketing, revenue, and business leaders | Organic revenue, qualified leads, conversion rate, visibility, priority-page index coverage, major losses, and open critical incidents | Daily or weekly, depending on data freshness | Where investment or escalation is needed to meet business goals |
| SEO operations | SEO managers and specialists | Indexed priority URLs, rank shifts, clicks, impressions, crawl anomalies, page-group traffic, conversions, alerts, and deployment notes | Daily or near-daily when available | Which segments need investigation, testing, optimization, or communication |
| Technical health | Engineering, platform, and technical SEO | 4xx/5xx rates, response times, uptime, robots.txt, sitemaps, canonicals, renderability, crawl requests, and deployment changes | Continuous or near-real-time for system signals | Whether to roll back, remediate, throttle, or investigate infrastructure and template changes |
| Diagnostic | SEO, engineering, analytics, and content | URL evidence, query changes, log samples, index status, canonical and robots directives, template, page-group, device, country, and conversion-path detail | On demand or by source latency | What caused the alert, which URLs are affected, and whether recovery is confirmed |
Maintain a KPI dictionary with formulas, sources, owners, time zones, attribution windows, update intervals, and limitations. Set rules for the URL taxonomy so every URL is consistently assigned to a business unit, country, product, template, funnel stage, and priority tier.
Show the last update and the data-available-through timestamp. Include deployment notes and consistent comparison windows. Let users drill down from business unit → page group → template → URL, with query and technical evidence where available. Search Console’s Page Indexing report can provide overall totals, but some views list only 1,000 URLs. Do not treat those drill-down views as complete URL inventories.
Assign owners and review schedules so alerts lead to action.
Set Review Schedules and Assign Response Owners
Monitor uptime, server errors, robots changes, and deployments continuously. Review indexation, ranks, traffic, and data freshness daily; page groups weekly; attribution and business results monthly; and governance quarterly.
Assign one accountable owner and a backup per alert. SEO validates and prioritizes. Engineering fixes technical failures. Analytics checks collection and attribution. Content investigates intent and template patterns, while revenue teams confirm commercial impact. Record acknowledgment and escalation deadlines, evidence, actions, and recovery-check dates.
Use explicit timestamps, such as October 6, 2026, 2:00 PM ET.
Track false positives and the time taken to acknowledge, validate, remediate, and recover. Close incidents only after technical checks and available downstream signals support recovery.
Conclusion: Monitor SEO Health and Business Results
Enterprise SEO monitoring connects crawl health, visibility, traffic, and revenue to business outcomes. Start with crawl access and indexability. Then track visibility, traffic, conversions, and revenue by stable page group. Include assisted conversions so last-click data doesn't understate SEO's contribution. Teams need to act on verified issues, not raw fluctuations.
The workflow is straightforward: define KPIs, set baselines, set alerts using site-specific thresholds, check data freshness, isolate affected groups, assign owners, fix issues, and confirm recovery. Missing data is not traffic loss; a technical fix is not recovery.
After a fix, measure recovery at the page-group level before closing the incident. Google may take several days to several weeks to recrawl changed pages. Close the incident only when access, indexability, visibility, and business signals recover in the affected group.
FAQs
Which SEO KPIs should I prioritize first?
Start with KPIs tied to your business objectives and revenue goals: revenue attribution, pipeline contribution, lead quality, and conversion rates.
Then track technical metrics that protect revenue: crawl errors, index coverage, and Core Web Vitals. Monitor organic traffic and keyword rankings to spot growth trends.
To manage these metrics at scale, Top SEO Marketing Directory lists software and agencies focused on organic growth.
How do I set thresholds for low-traffic page groups?
Group keywords or pages that move together to set useful performance baselines and cut alert noise. Report monthly rather than weekly, since low traffic volumes often leave too little data for weekly analysis.
Set alerts for major trends, such as sharp traffic drops or technical errors, instead of small daily changes. Use quadrant charts, bounce rate, or time on page to spot opportunities for improvement.
How can I isolate SEO’s impact on revenue?
Connect your SEO and analytics data to your CRM and marketing automation platforms. This lets you link organic sessions and clicks to marketing-qualified leads (MQLs), sales-qualified leads (SQLs), opportunity values, and closed-won revenue.
Use multi-touch or data-driven attribution instead of last-click attribution to account for SEO’s role throughout the customer journey. Compare organic performance with paid media costs to calculate the dollar value of organic traffic and show its ROI.