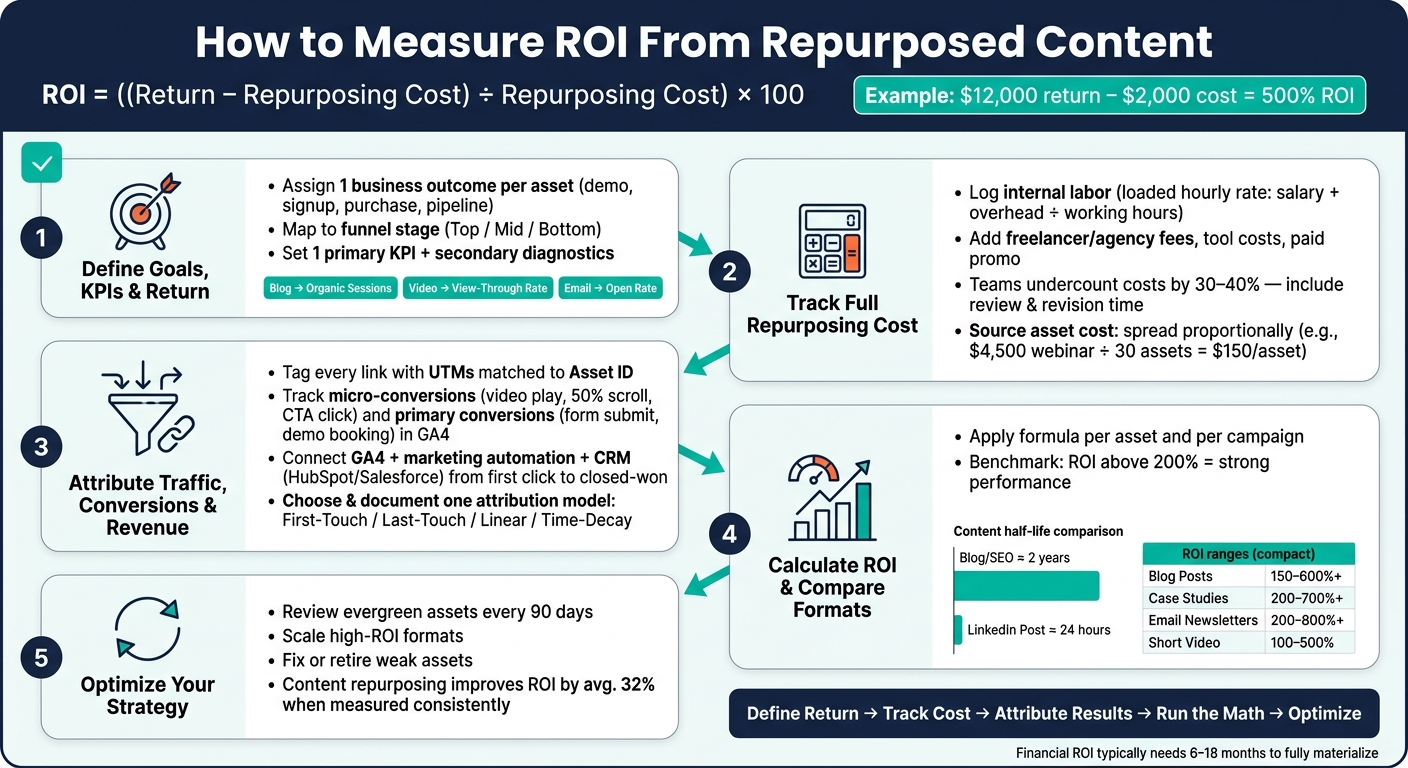
If I can’t tie repurposed content to money or pipeline, I can’t call it ROI. The basic formula is simple: ROI = ((return - repurposing cost) / repurposing cost) x 100. So if a repurposed asset brings in $12,000 and costs $2,000, the ROI is 500%.
Here’s what I need to do to measure it without guesswork:
- Pick one business goal per asset, like a demo request, signup, purchase, or sales opportunity
- Track only the extra return from the repurposed piece, not the source asset’s past results
- Log every cost, including staff time, tools, freelancers, and paid distribution
- Use UTMs, GA4 events, marketing automation, and CRM data to connect each asset to traffic, conversions, pipeline, or revenue
- Choose one attribution model and stick with it
- Compare formats over time, because a blog post may keep working for about 2 years, while a social post may fade in about 24 hours
- Review performance every 90 days and decide what to scale, update, or stop
If direct revenue is hard to track, I can still use influenced pipeline, lead value, or traffic value as a stand-in. The main point is simple: define return, track cost, match results, then run the math.
How to Measure ROI From Repurposed Content: 5-Step Framework
Unlocking Podcast ROI with Metrics, Content Repurposing, and Brand Loyalty Strategies
sbb-itb-5be333f
Step 1: Define Goals, KPIs, and What Counts as Return
Before you open any SEO marketing tools or analytics dashboards, get clear on what you're measuring and why it matters. That choice sets the revenue side of your ROI equation.
Choose business outcomes for each repurposed asset
Give each repurposed asset one business outcome: demo request, purchase, signup, form fill, or sales opportunity. Here's the simple rule: if the asset doesn't support a real buyer decision, don't treat it as revenue-driving. It's not a good pick for ROI measurement.
Those outcomes decide which results belong in the ROI formula.
It also helps to map each asset to a funnel stage. Top-of-funnel assets frame the problem, like short social videos or checklists. Mid-funnel assets help buyers compare options, such as comparison infographics and case studies. Bottom-of-funnel assets deal with pricing questions and objections, like FAQ blocks and sales one-pagers.
Set KPIs for direct and indirect value
Assign one primary KPI to each asset. Use secondary metrics only to diagnose performance.
Secondary metrics like scroll depth, shares, or listen completion can help explain why an asset did well or fell flat, but they shouldn't run your ROI calculation. For longer B2B sales cycles, track assisted conversions and influenced pipeline too. That means deals where a repurposed asset showed up as a touchpoint before the sale closed, even if it wasn't the last click.
| Asset Type | Primary KPI | Secondary KPI | Business Outcome |
|---|---|---|---|
| Long-form Blog | Organic Sessions | Time on Page | Discovery and SEO depth |
| Short Social Video | View-Through Rate (VTR) | Shares | Attention and viral potential |
| Email Snippet | Open Rate | Click-to-Open Rate (CTOR) | Direct response and intent |
| Infographic | Social Shares | Backlinks | Awareness and link equity |
| Podcast Clip | Listen Completion | Website Clicks | Authority and influenced pipeline |
Separate repurposing value from the original asset
Measure only the incremental return from the repurposed asset. Don't give it credit for results the original webinar or whitepaper already earned. If you keep costs and returns separate for each derivative asset, attribution stays clean.
Next, track the costs tied to each repurposed asset.
Step 2: Track the Full Cost of Repurposing Content
Once you’ve defined return, the next job is figuring out what each repurposed asset actually costs.
This is where teams often get tripped up. A lot of marketing teams undercount repurposing costs by 30–40% when they leave out review time, internal back-and-forth, and revision rounds.
Record labor, tools, vendors, and paid distribution
If money or time went into making or pushing a repurposed asset, it belongs in the cost log.
That includes internal staff time for planning, production, editing, and review. It also includes freelancer or agency fees, software subscriptions, transcription services, asset-level costs like stock media, transcription, or guest fees, and any paid promotion.
For internal labor, use a loaded hourly rate:
(salary + overhead) ÷ working hours
Then track the exact minutes per asset in a time log. That way, you’re working from actual effort, not rough estimates.
Paid ad spend, influencer fees, and syndication costs should stay tied to the specific repurposed piece they support. If a video clip got $300 in paid distribution, log that against the clip itself, not against the whole campaign.
Exclude the original creation cost unless it is reused proportionally
Don’t include the source asset’s original creation cost by default.
The exception is when the source piece was built as a repurposing hub. In that case, spread its cost across the assets that came from it. For example, a $4,500 webinar built as a content hub for 30 spin-off assets adds $150 per asset from the source alone.
That one detail can change the math fast.
Build a simple monthly or quarterly cost log
You don’t need fancy software here. A spreadsheet is enough.
What matters is using the same format every time so you can compare assets across campaigns without redoing the math from scratch. Use the same Asset IDs and KPIs you set in Step 1.
| Log Column | What to Record |
|---|---|
| Date | Publication or completion date (YYYY-MM-DD) |
| Asset ID | Unique slug or GUID linking the spin-off to its source piece |
| Format | Video clip, email snippet, carousel, blog summary, etc. |
| Internal Hours | Total staff time spent on planning, production, editing, and review |
| Hourly Rate | Loaded rate in USD (salary + overhead) |
| Outside Fees | Freelancer, agency, or transcription payments in USD |
| Tool Costs | AI credits or software subscription fees allocated to this asset |
| Paid Promo | Ad spend used to distribute this specific asset |
| Total Cost | Sum of labor, fees, tools, and promotion |
Use the same Asset ID from Step 1 so cost data can be matched to performance data later.
A monthly or quarterly log makes asset comparison much easier. A 30–90 day window works well for efficiency checks, while financial ROI usually needs 6–18 months.
Next, match these costs to traffic, conversions, and revenue.
Step 3: Attribute Traffic, Conversions, and Revenue to Repurposed Assets
Once you've logged costs, the next job is simple in theory and messy in practice: connect each repurposed asset to results. If you skip attribution, you can't say which asset drove traffic, conversions, or revenue.
Use UTMs and conversion events
Tag every repurposed link with consistent UTMs so you can see the source, campaign, and format. Each UTM should match the same Asset ID in your cost log. If your naming rules change over time, add a version tag. That small step can save a lot of cleanup later.
In GA4, track both micro-conversions and primary conversions as specific events. Micro-conversions show how far people got and how interested they were. Think video plays, 50% scroll depth, and CTA clicks. Primary conversions show stronger buying intent, like form submissions and demo bookings.
| Event Name | Trigger Condition | What It Measures |
|---|---|---|
video_play |
User starts a video clip | Play count / initial interest |
scroll_50 |
User reaches 50% of page | Engagement depth |
cta_click |
Click on a specific CTA button | Click-through rate |
form_submit |
Successful lead form submission | Conversion count |
content_share |
Use of native share buttons | Reach |
Before you trust the numbers, verify events in GA4 DebugView or Tag Manager preview mode.
Pull data from analytics, marketing automation, and CRM systems
Use GA4, your marketing automation tool, and your CRM together to follow each touchpoint from click to closed-won revenue. For gated content, track downloads, form submissions, and webinar sign-ups. Your CRM - whether that is HubSpot or Salesforce - ties those content touches to pipeline stages and closed-won revenue.
Trace each asset from the first click all the way to closed-won revenue.
If CRM integration isn't set up yet, use a traffic value proxy instead. Multiply organic sessions by the matching cost-per-click for those keywords in Google Ads. It's not perfect. But it does give you a dollar-based estimate you can use right now.
Choose an attribution model and document it
Attribution models decide which touchpoint gets credit for a conversion. There isn't one right answer for every team. The best model depends on your sales cycle and what you're trying to measure.
| Attribution Model | How Credit Is Assigned | Best For |
|---|---|---|
| First-Touch | 100% to the first interaction | Measuring discovery and top-of-funnel awareness |
| Last-Touch | 100% to the final step before conversion | Short sales cycles or direct-response campaigns |
| Linear (Multi-Touch) | Split evenly across all touchpoints | General brand building and full-funnel visibility |
| Time-Decay | More credit to touchpoints closer to conversion | Long B2B sales cycles of 3–12 months |
Write down the attribution model, conversion definition, and UTM templates in one shared spec. Also add a "How did you hear about us?" field for self-reported attribution.
Next, you'll use those totals to calculate ROI and compare formats and channels.
Step 4: Calculate ROI and Compare Formats or Channels
Calculate ROI for one asset and for a full repurposing campaign
Once you have cost data and attribution set up, you can calculate ROI with this formula:
ROI = [(Total Revenue Attributed − Total Cost of Repurposing) ÷ Total Cost of Repurposing] × 100
For a single asset, the return side can be direct revenue, influenced pipeline, or lead value. For a full repurposing campaign, add up all repurposed assets and include internal labor, freelancer or agency fees, tool subscriptions, and paid distribution in total cost.
It also helps to track cost per asset. That makes it easier to spot efficiency gains before they get buried in campaign-level numbers. As a general benchmark, content ROI above 200% is often seen as strong.
The next step is simple: compare formats and channels using the same rules.
Compare ROI by content format and distribution channel
After you calculate ROI, compare each format based on cost, half-life, and assisted value.
Email newsletters and blog posts often deliver the highest ROI because they usually cost less to produce and can keep driving results over time. That shelf life matters more than many teams think. Blog and SEO content can last about 2 years, while LinkedIn posts may fade after about 24 hours.
Use the same attribution model across every format. If you change the rules from one channel to another, the comparison falls apart. Assisted assets should still get credit for the revenue they help influence. And for top-of-funnel content, it makes more sense to track influenced pipeline and micro-conversions instead of judging everything by direct conversions alone.
A clear pattern shows up here: formats with longer half-lives - like blogs, case studies, and podcasts - often beat short-lived social posts on a per-dollar basis over 6–18 months. That doesn't mean you should drop social. It means you should put more of your budget into formats that keep working long after the publish date.
Repurposed content performance comparison table
Use the table below as a benchmark, not a target. ROI ranges are estimates.
| Content Type | Estimated ROI Range | Primary Metric | Secondary Metric |
|---|---|---|---|
| Blog Posts | 150%–600%+ | Organic Sessions | Time on Page |
| Case Studies | 200%–700%+ | Influenced Pipeline | Sales Team Usage |
| Email Newsletters | 200%–800%+ | Click-to-Open Rate | Conversion Rate |
| Short Video | 100%–500% | View-Through Rate | Shares |
| Infographics | Variable | Social Shares | Backlinks |
| LinkedIn Posts | Variable | Engagement Rate | Assisted Pipeline |
Step 5: Use ROI Data to Improve Your Repurposing Strategy
Scale high-performing assets and fix weak ones
Once you've compared ROI by format and channel, use that data to choose what to do next. Scale what works. Fix or stop what doesn't.
Review evergreen assets every 90 days. Update stats, swap out dated references, and look for patterns that show whether an asset needs a new hook, a new format, or a full retirement.
| Signal | What It Means | Action |
|---|---|---|
| High clicks, low depth | The headline works; the content doesn't fully deliver | Keep the hook, then tighten the format into a listicle or newsletter item |
| High depth, low clicks | The content is strong; the packaging is weak | Write a new benefit-driven headline or add a visual hook |
| High traffic, low conversion | Wrong intent, weak CTAs, or the wrong audience | Audit CTAs and verify the channel reaches your target buyer |
There's a simple rule here: don't repurpose weak assets just to make more stuff. More output doesn't help if the source piece isn't doing its job.
Use Top SEO Marketing Directory to find measurement and optimization support
If you need help with analytics or optimization, Top SEO Marketing Directory can point you to tools and services for content performance reporting, keyword research, and technical SEO tied to repurposed content performance.
Conclusion: Track costs, attribute results, and optimize continuously
After you make these fixes, treat ROI review like a repeatable cycle, not a one-time check.
Measure ROI by defining return, tracking cost, attributing results, and using what you learn to improve future repurposing. Then use that data to decide what to scale, refresh, or retire.
Content repurposing strategies improve ROI by an average of 32%. But that number holds up only if you keep measuring, comparing, and making calls based on what the data shows. Track costs, attribute results, and use ROI data to improve the next round of repurposing.
FAQs
How long should I track ROI after publishing?
Track ROI in three phases:
- 30–90 days: watch time saved and how much content your team is putting out
- 3–6 months: check engagement, traffic growth, and lead volume
- 6–18 months: calculate actual ROI, including revenue attribution and the compounding value of traffic
For most teams, the first financial read you can trust shows up at about the six-month mark.
What if I can’t tie repurposed content to direct revenue?
If you can’t link repurposed content straight to revenue, look at intermediate metrics instead. These give you a clearer read on long-term growth without forcing a direct sales tie-in too early.
Start with engagement signals like time on site, social shares, and view-through rates. Those numbers can tell you whether people are sticking around, paying attention, and passing the content along.
It also helps to track efficiency gains. For example, compare the time and resources saved by reworking existing content versus making something from scratch. That matters more than a lot of teams think.
Then look at lead quality and assisted conversions. This shows how repurposed assets help move people through the sales pipeline, even when they aren’t the final touchpoint.
Which attribution model should I use for repurposed content?
Don’t rely on just one attribution model. A single-touch view only shows part of the customer journey.
Instead, compare first-touch, last-touch, and linear models in your analytics platform.
Here’s the simple version:
- First-touch shows what brought the user in
- Last-touch shows what pushed the conversion
- Linear splits credit across each interaction
When you compare all three, you get a clearer picture of how each repurposed content asset contributes along the way.