If I had to boil this down to one line: Instagram CTR in 2026 is not one number - it shifts most by placement, then by industry, then by campaign goal.
Here’s the short version:
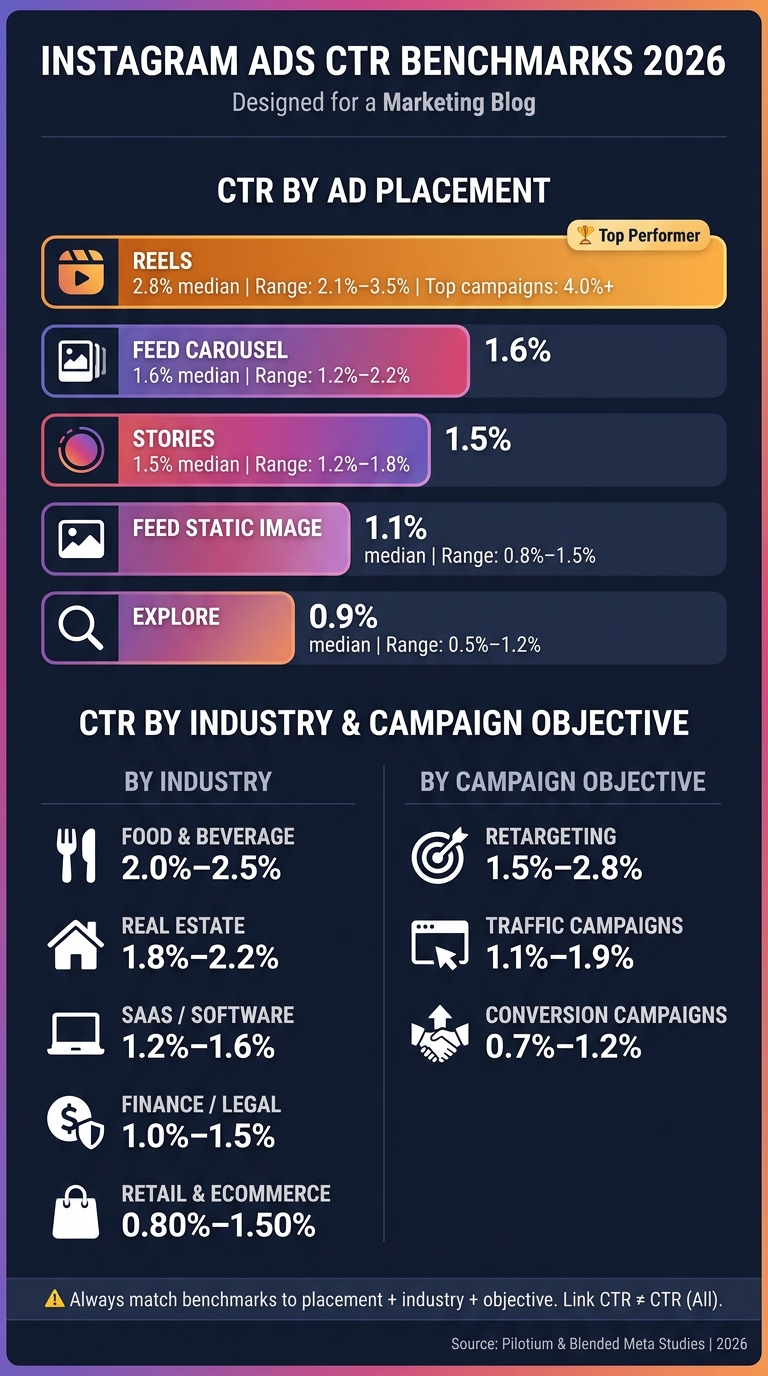
- Reels leads at about 2.8% median CTR
- Stories often sit near 1.5%
- Feed carousel tends to beat Feed static - about 1.6% vs. 1.1%
- Explore is often lower - about 0.9%
- Traffic campaigns usually beat conversion campaigns on CTR
- Retargeting usually posts the highest CTRs
- Blended Meta data can mislead you if you compare it with Instagram-only placement data
- CTR (All) and Link CTR are not the same thing
That last point matters more than most people think.
If I compare the wrong click type, or I mix Feed, Stories, and Reels into one average, I can make a good account look weak - or a weak account look fine. So the clean way to judge Instagram CTR in 2026 is simple: match benchmark to placement, industry, and objective first.
A few numbers set the tone fast:
- Blended Meta CTR often lands around 1.56% to 2.19%
- Some campaigns come in below 1%
- Strong Reels campaigns can clear 4%+
- Consumer categories like Food & Beverage can run above 2%
- SaaS, finance, and legal often run lower
My takeaway: if your Reels CTR is 1.0%, that may be weak. If your conversion-focused SaaS Feed campaign is near 0.9%, that may be fine. Same metric - very different read.
Use this article to sanity-check your numbers, spot bad comparisons, and set targets that fit how your account is actually built.
Instagram Ads CTR Benchmarks by Placement & Industry 2026
2026 Instagram CTR Benchmarks by Placement
Use placement as your starting point. Then adjust for industry and campaign objective.
Feed ads: median and upper-range CTR figures
Feed usually posts the lowest CTR. Static image ads sit at a 1.1% median CTR, with a typical range of 0.8%–1.5%. Carousel ads do better, with a 1.6% median and a 1.2%–2.2% typical range.
If Feed static CTR drops below 0.9%, it needs a closer look. Low CTR can push CPMs up and hurt delivery.
Stories and Reels: CTR benchmarks for full-screen formats
Full-screen placements beat Feed on CTR more often than not. Instagram Stories usually comes in around a 1.5% median CTR, with a 1.2%–1.8% range.
Reels is the clear standout in 2026. It posts a 2.8% median CTR and a 2.1%–3.5% typical range, while top campaigns can hit 4.0%+. Compared with Feed static - 2.8% versus 1.1% - that spread points to two things: the pull of a full-screen format and the algorithm’s heavy push of Reels inventory.
Explore ads and blended Meta placement data
Explore reaches people who are already in discovery mode, but public benchmark data is thinner here than it is for Feed, Stories, or Reels. Current estimates put Explore at about a 0.9% median CTR, with a typical range of 0.5%–1.2% and upper-end results around 1.5%+. Since Explore data is often mixed into Feed or other discovery numbers, treat these figures as directional.
One more thing: blended Meta benchmarks can make Instagram look weaker than it is. A lot of studies group Instagram and Facebook together under Meta. Before you use any benchmark, check whether it’s Instagram-only or Meta-wide.
| Placement / Format | Median CTR | Typical Range | Upper-End CTR | Source | Metric Definition |
|---|---|---|---|---|---|
| Feed (Static Image) | 1.1% | 0.8%–1.5% | 2.0%+ | Pilotium | Link CTR |
| Feed (Carousel) | 1.6% | 1.2%–2.2% | 2.8%+ | Pilotium | Link CTR |
| Stories | 1.5% | 1.2%–1.8% | 2.5%+ | Multiple | Link CTR |
| Reels | 2.8% | 2.1%–3.5% | 4.0%+ | Pilotium | Link CTR (Video) |
| Explore | 0.9% | 0.5%–1.2% | 1.5%+ | Multiple | Blended Meta Benchmarks |
Use these placement baselines before you compare by industry or campaign objective. Placement is the first benchmark layer. Industry and objective move the target from there.
sbb-itb-5be333f
2026 CTR Benchmarks by Industry and Campaign Objective
Use the placement benchmarks above as the starting point. The figures here show how industry and campaign objective tend to move those numbers up or down. They come from blended Meta studies that also include Instagram, so it's best to treat them as directional.
Consumer categories: retail, food, and ecommerce
In consumer categories, Food & Beverage and retail and ecommerce show the clearest 2026 ranges.
Food & Beverage usually lands around 2.0%–2.5% blended CTR, with an upper range of 4.0%+. Retail and ecommerce tends to come in lower, with a typical band of 0.80%–1.50% and an upper range of 2.50%+.
That pattern makes sense. Consumer CTR tends to be strongest when the creative has strong visual pull and lines up with clear buying intent.
B2B and regulated sectors: finance, legal, real estate, and software
B2B and regulated categories usually post lower CTRs than consumer campaigns.
Finance / Legal tends to land around 1.0%–1.5% blended CTR, with upper-range results at 2.5%+. Real Estate usually sits at 1.8%–2.2%, with upper-range performance around 3.5%+. SaaS / Software is often in the 1.2%–1.6% range, and educational or lead-gen creative often beats direct demo offers.
A lower CTR here doesn't always mean the campaign is underperforming. In regulated and high-consideration industries, it often reflects tighter intent and a more selective click.
How CTR benchmarks shift by campaign objective
Campaign objective changes the benchmark in a pretty direct way. Traffic campaigns usually run higher than conversion campaigns, and retargeting tends to run highest.
Traffic campaigns usually post around 1.1%–1.3% CTR on Feed and 1.4%–1.9% on Stories/Reels. Conversion campaigns average closer to 0.7%–0.9% on Feed and 0.9%–1.2% on Stories/Reels. Retargeting campaigns are strongest overall, with CTRs usually ranging from 1.5% to 2.8%.
So when you compare performance, make sure you're matching the benchmark to the objective, placement mix, and source definition. If you don't, the comparison can get off track fast.
| Industry / Category | Typical CTR Band | Upper Range | Notes |
|---|---|---|---|
| Retail and ecommerce | 0.80%–1.50% | 2.50%+ | Higher in retargeting |
| Food & Beverage | 2.0%–2.5% | 4.0%+ | Strong visual appeal |
| Real Estate | 1.8%–2.2% | 3.5%+ | High local intent |
| Finance / Legal | 1.0%–1.5% | 2.5%+ | Lower CTR due to friction and a narrower audience |
| SaaS / Software | 1.2%–1.6% | 2.8%+ | Educational and lead-gen creative tends to perform best |
| Traffic Objective | 1.1%–1.3% | 3.0%+ | Broad reach focus |
| Conversion Objective | 0.7%–0.9% | 2.5%+ | Narrower, high-intent delivery |
| Retargeting (All) | 1.5%–2.8% | 4.0%+ | Warm audience advantage |
Use the table for a quick side-by-side view. The notes in the sections above explain the main pattern behind each group.
How to Compare Your Account Against 2026 Benchmarks
Use the placement and industry ranges above to judge your account against the right benchmark. Do not compare a blended CTR to a placement-specific standard.
A step-by-step benchmark comparison workflow
Use the tables above to score each placement and campaign type against the right range.
Start by exporting CTR by placement from the Meta Professional Dashboard or Business Suite. Feed, Stories, and Reels need to be reviewed on their own because blended reporting can hide big placement gaps.
Then split the data in this order:
- By placement
- By campaign intent - prospecting vs. retargeting
- By the closest industry benchmark
Once you have those groups, compare each one against both the median and the 75th percentile. That gives you a better read than looking at one benchmark point alone.
The diagnostic table below gives you a quick read on where each campaign group stands.
| Performance Band | Meaning | Next Check |
|---|---|---|
| Below 25th percentile | Creative or audience mismatch; fatigue possible. | Audit audience targeting; refresh creative assets; check landing page load speed. |
| Around median | Healthy baseline; performing at industry standard. | A/B test headlines and CTA copy to push toward the top quartile. |
| Above 75th percentile | Strong offer-market fit; high-resonance creative. | Check conversion rate and ROAS to confirm traffic quality; watch frequency for fatigue. |
Common errors that distort CTR benchmarking
Once you've matched your account to the right benchmark, look for a few common distortions.
The biggest mistake is using CTR (All) instead of Link Click CTR. CTR (All) includes likes and comments that don't send traffic to your site. So if you compare that number against a benchmark based on link clicks, your account can look better than it is.
Another mistake is mixing retargeting and prospecting into one benchmark view. Those audiences behave differently, so the comparison gets muddy fast.
Audience freshness matters too. If frequency is above 4 and CTR is dropping, treat that as fatigue - not a benchmark problem.
And here's a simple gut check: high CTR with low conversions usually means weak click quality. People are clicking, but the traffic isn't lining up with the offer or landing page.
Using benchmark resources and directories for ongoing validation
Benchmark data changes over time, and no single study covers every sub-industry or placement mix.
For ongoing validation, Top SEO Marketing Directory can help you shortlist tools for measurement, CAC tracking, and cross-channel reporting.
Conclusion: What Counts as Competitive Instagram CTR in 2026
There isn’t one Instagram CTR that counts as "competitive" in 2026. The right target depends on your industry. Consumer campaigns can land well above SaaS, while ecommerce tends to fall somewhere in between. And even inside the same industry, placement shifts the benchmark. Reels often beat Feed and Stories, so start with placement, then look at industry, then objective.
Median performance means you’re keeping pace with the market - not beating it. The top quartile tells a different story. That’s where stronger creative can push CTR well past the median, and that spread is where the edge shows up.
The practical rule is straightforward: match your data to the right benchmark - placement, industry, and objective - and compare it only against current benchmarks that use the same click definition.
FAQs
What is a good Instagram CTR in 2026?
In 2026, a good Instagram click-through rate, or CTR, depends on where the ad appears and what industry you're in. For standard feed placements, 0.5% to 1.5% is a solid range.
That said, averages can shift a lot by industry. Travel & Tourism often lands around 2.20%, while Real Estate and Legal tend to sit closer to 0.99%.
So don't stack your numbers against a broad platform average and call it a day. Compare your CTR to your own industry benchmarks. That's the cleaner read.
Timing matters too. Seasonal spikes, especially in Q4, can push CTR up to 5.3%.
Should I use Link CTR or CTR (All)?
It depends on your campaign objective.
Link CTR is the better metric when you want to measure clicks to your intended destination - like a website or landing page.
CTR (All) counts every ad interaction, including likes, comments, shares, and image expands. So if your main goal is traffic, Link CTR is usually the clearer signal.
How should I benchmark Reels vs. Feed?
Benchmark Reels and Feed ads against their own format-specific CTR averages, not one platform-wide number.
Recent 2026 data shows Reels usually beat Feed on click-through rate. They account for over 50% of user attention and can hit CTRs around 2.8% in some sectors. Feed ads, by comparison, tend to draw less engagement.
That’s why format-specific averages give you the clearest benchmark. If you stack Reels and Feed against one blended platform number, you blur the differences that matter.