Testing Core Web Vitals on mobile devices is critical for improving user experience and search rankings. Mobile traffic dominates the web, and slow load times or poor interactivity can lead to high abandonment rates. Tools like Sematext, WebPageTest, GTmetrix, Google PageSpeed Insights, and Chrome DevTools help evaluate and optimize key metrics like Largest Contentful Paint (LCP), Interaction to Next Paint (INP), and Cumulative Layout Shift (CLS). Here's a quick overview:
- Sematext: Combines synthetic and real user monitoring, starting at $5/month.
- WebPageTest: Offers detailed network throttling and bulk testing, free with premium plans from $15/month.
- GTmetrix: Focuses on mobile-specific analysis, with PRO plans starting at $4.25/month.
- Google PageSpeed Insights: Free tool combining lab and field data for actionable insights.
- Chrome DevTools: Free, built-in browser tools for emulating mobile devices and analyzing performance.
For the best results, use multiple tools to combine field and lab data, ensuring accurate testing and optimization for mobile performance.
Page Experience, Core Web Vitals and Mobile Usability | Google Search Console - Part 6
1. Sematext
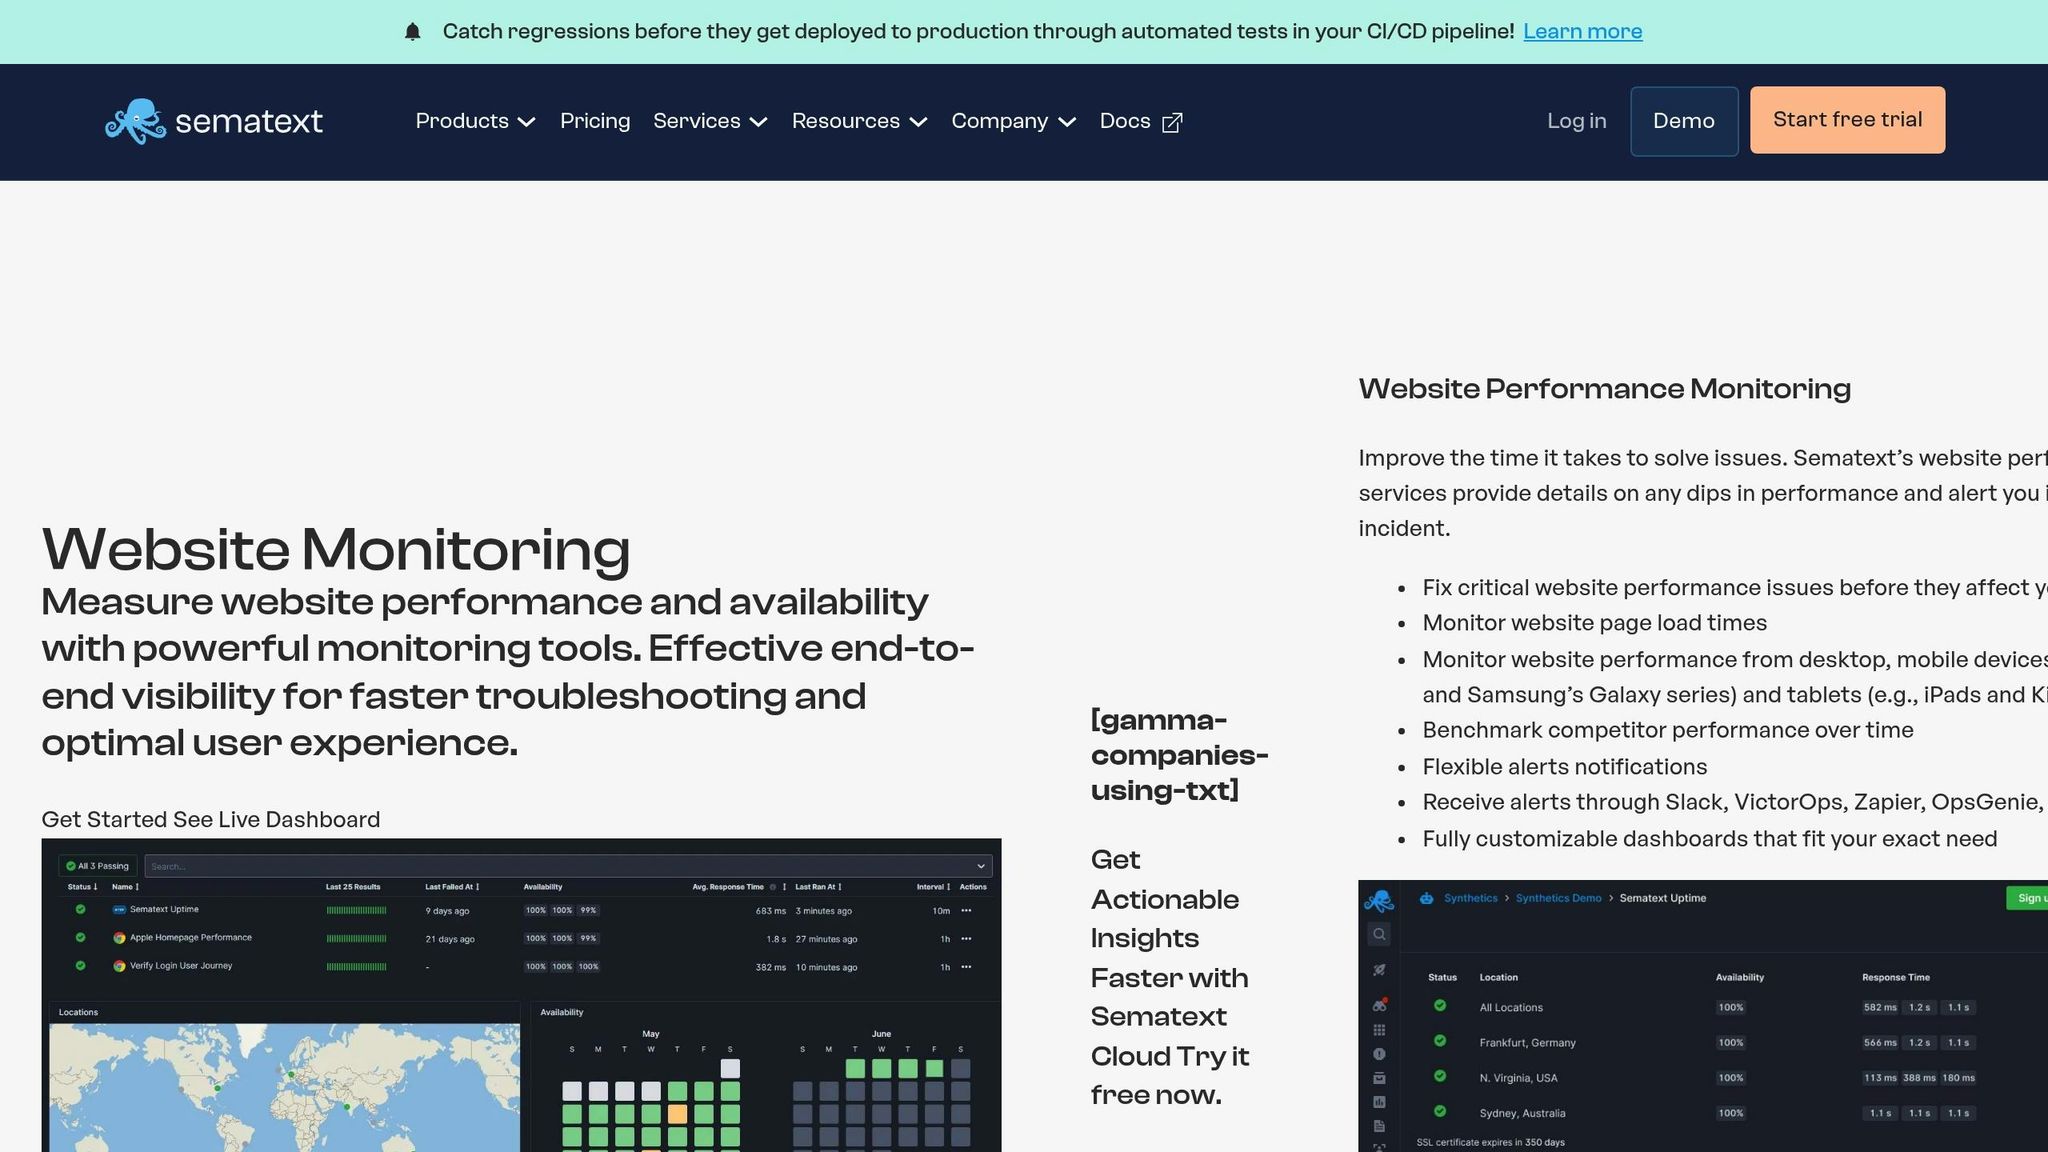
Sematext offers a blend of synthetic testing and real user monitoring to assess and improve your mobile Core Web Vitals performance. Its tools are designed to help you test and fine-tune your site across various devices and network conditions, ensuring a smoother experience for mobile users.
Here’s a quick look at the two primary tools Sematext provides for Core Web Vitals testing:
- Sematext Synthetics: This tool allows you to simulate user interactions on mobile devices. You can choose specific devices like an iPhone 8 or Samsung Galaxy, script user journeys, capture errors, and even record screenshots to analyze performance.
- Sematext Experience: A real user monitoring tool that collects actual user data. It lets you filter results by connection types such as 2G, 3G, or 5G - offering insights into how real-world network conditions affect your mobile users.
The platform also includes handy features like real-time debugging, alert notifications, and a Split Screen view to compare synthetic and real user data side by side. This makes it quicker to pinpoint and resolve performance issues.
"Using Sematext, we've been able to detect and resolve issues 50% faster, providing a smoother experience for our users and improving customer satisfaction." - Iman Fadaei, Founder & Director
Sematext suggests starting with synthetic monitoring to quickly identify potential problems, then using real user monitoring to confirm and refine the results.
Pricing is straightforward and flexible. Real user monitoring starts at $9/month for 25,000 views. Synthetic monitoring is available on a pay-as-you-go basis - $2 per HTTP monitor, $7 per browser monitor, with a $5 minimum - or through fixed monthly plans starting at $29/month. A 14-day free trial is also available.
Up next, we’ll dive into another key tool for mobile performance testing.
2. WebPageTest
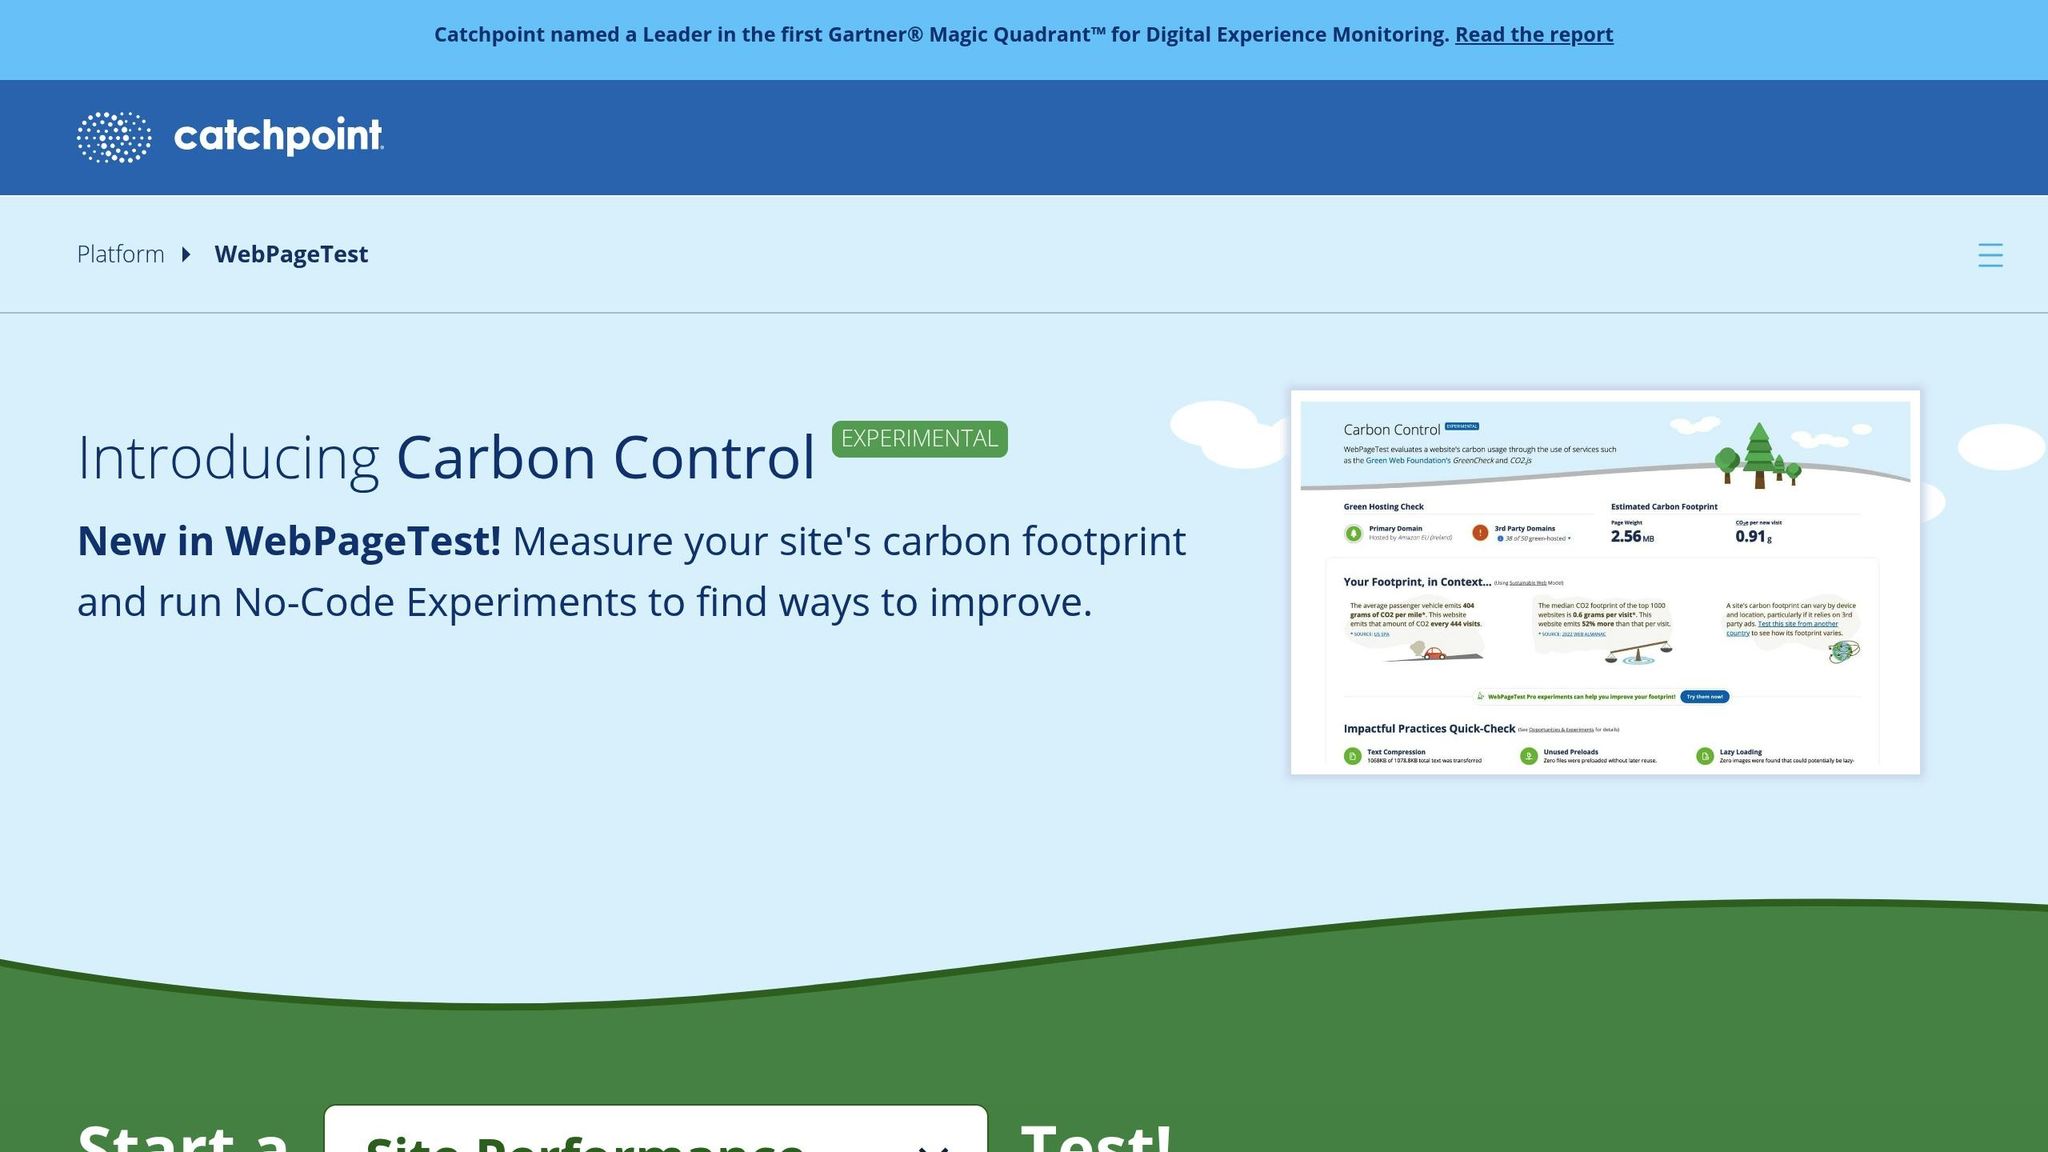
WebPageTest offers mobile testing that closely mirrors real-world conditions by using packet-level network throttling. This approach provides a more accurate representation of mobile network performance compared to traditional browser-based methods.
The platform stands out for its ability to simulate mobile devices and accommodate a variety of network conditions. You can test on connection types like 2G, 3G (Slow, Standard, Fast), 4G, LTE, and Mobile Edge, making it especially useful for understanding the experience of mobile users.
By utilizing actual Chrome browsers, WebPageTest ensures that test results reflect what real visitors encounter. For mobile-specific tests, you can either use real devices or emulate mobile browsers. A popular choice is the "Emulate Mobile Browser" option with the Motorola G (gen4) setting, which aligns with Lighthouse's testing standards.
The tool measures Core Web Vitals, including Largest Contentful Paint (LCP), First Input Delay (FID), and Cumulative Layout Shift (CLS). Its detailed waterfall charts highlight resource load times, helping you identify and address performance issues efficiently. Additionally, integrated recommendations simplify the process of resolving these problems.
Unlike Lighthouse, which uses fixed latency and bandwidth for its simulations, WebPageTest throttles at the packet level, giving a more precise view of actual mobile network speeds. For context, average mobile speeds in the U.S. range between 10.7 and 19.6 Mbps.
It’s a good idea to run tests multiple times, using the median result for accuracy. Be sure to analyze both "First View" and "Repeat View" data and test from locations close to your target audience for the most relevant insights.
WebPageTest offers a free tier with premium plans starting at $15 per month. Paid plans include features like bulk testing, access to premium testing locations, and priority in test queues for faster results. Interestingly, the free version is supported by Google as part of its efforts to enhance web performance.
Next: Learn how GTmetrix evaluates mobile Core Web Vitals.
3. GTmetrix
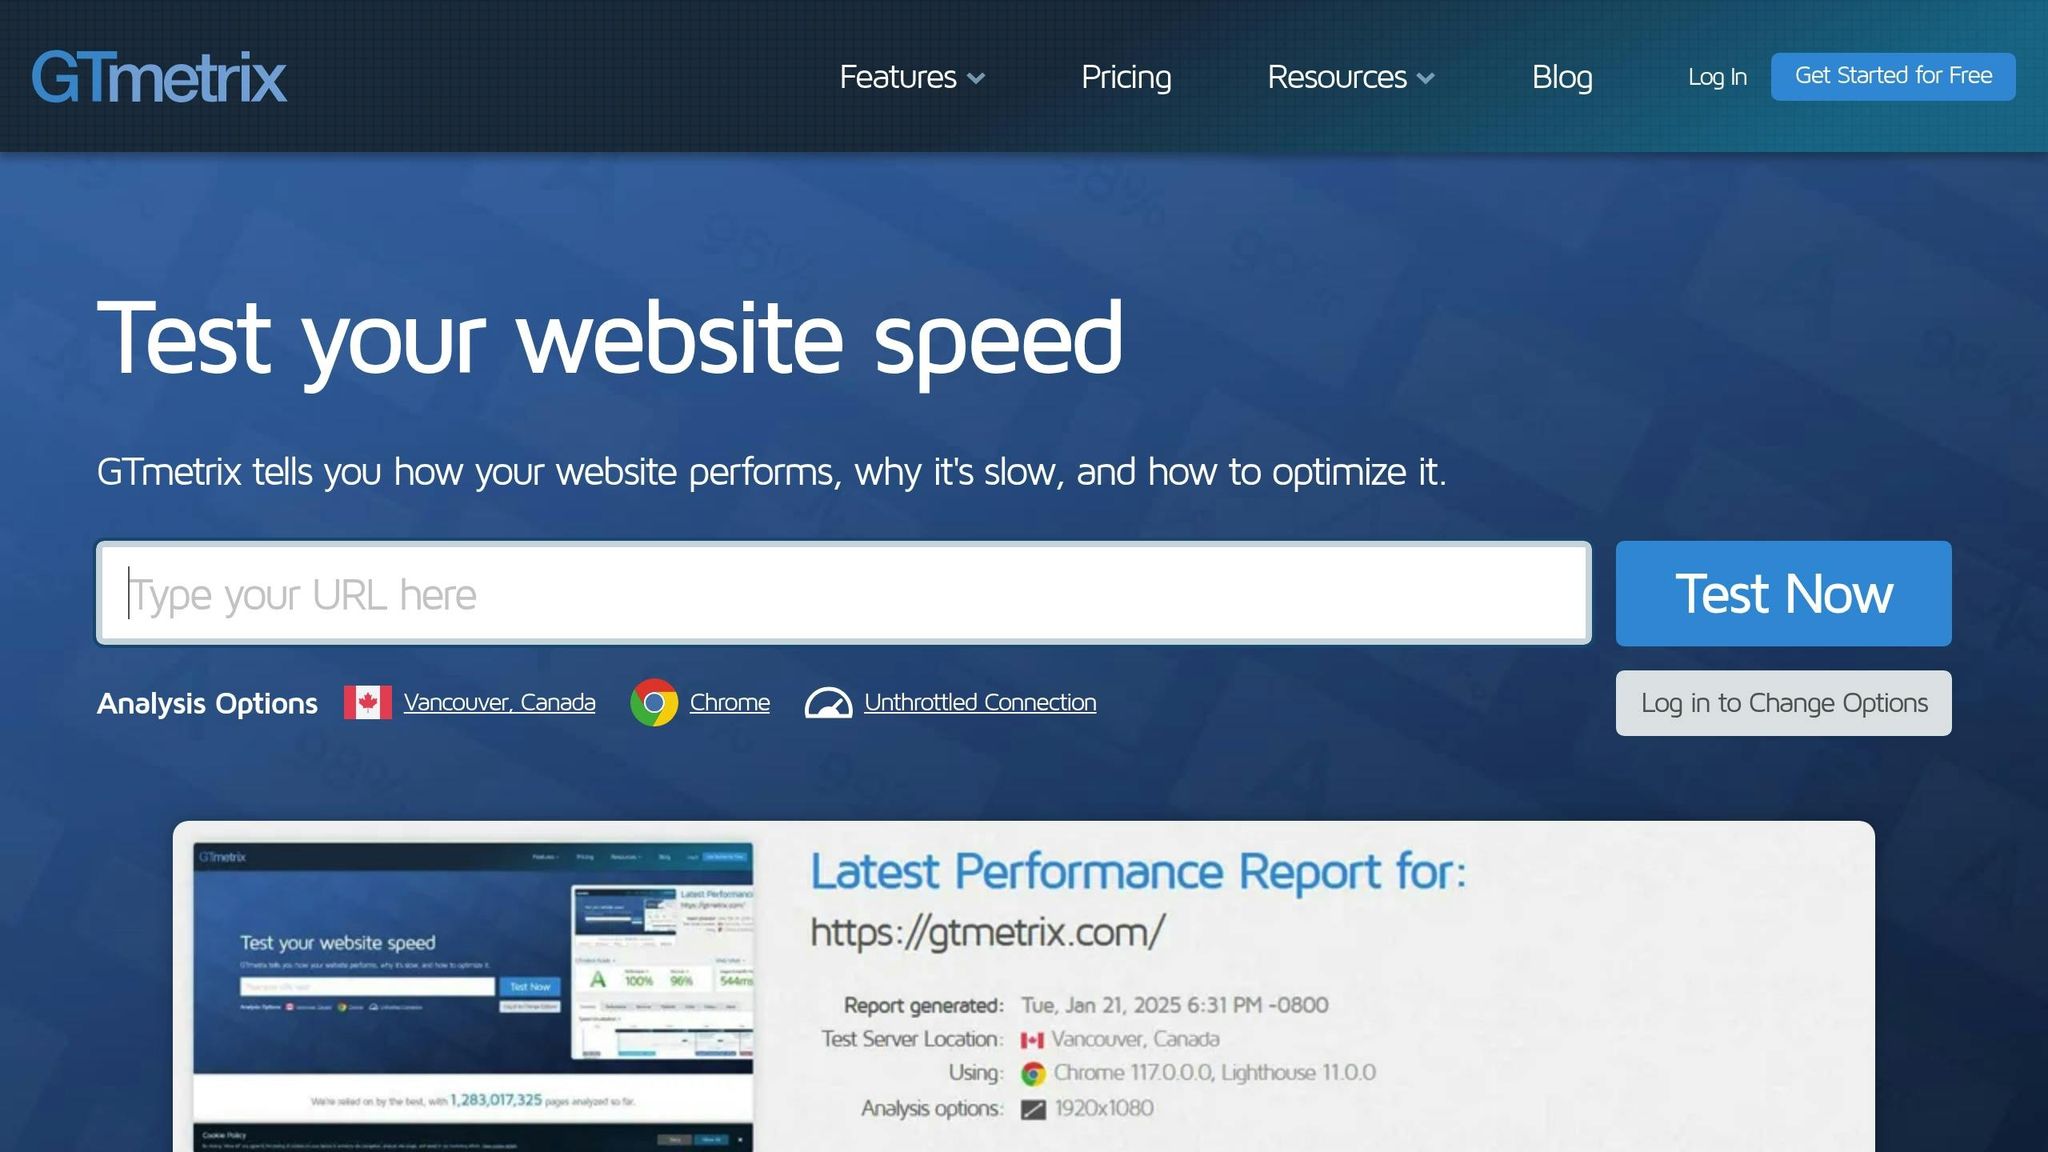
GTmetrix allows PRO users to test mobile Core Web Vitals using its Simulated Devices feature. This tool offers testing across more than 40 device types and variants, giving you a detailed look at mobile performance.
By adjusting screen resolution, user agent, and device pixel ratio, GTmetrix mimics specific mobile devices to create realistic testing conditions - no physical hardware required. This browser-based approach ensures results closely reflect the experiences of real users on their mobile devices.
For even more accuracy, GTmetrix incorporates detailed network simulation. It offers five predefined mobile connection speeds that mirror real-world conditions:
- LTE: 15/10 Mbps with 100 ms latency
- 4G Slow: 9/5 Mbps with 125 ms latency
- 4G: 5/1 Mbps with 150 ms latency
- 3G: 1.6 Mbps/768 Kbps with 200 ms latency
- 3G Slow: 750/500 Kbps with 250 ms latency
Need something more specific? You can customize connection speeds to match the network conditions your audience typically uses. GTmetrix achieves this by controlling download speeds, upload speeds, and latency for both IPv4 and IPv6 traffic.
Mobile tests generate Lighthouse reports, offering in-depth performance analysis. GTmetrix also applies Google's PageSpeed rules with a focus on mobile priorities, ensuring its recommendations align with current optimization standards.
Important Note: While GTmetrix simulates many device attributes, it does not replicate hardware performance like processing power or memory. As a result, actual loading behavior may vary on real devices.
For the most accurate results, GTmetrix suggests throttling your connection speed to match your audience's typical network conditions and testing from locations where most of your users are based. Analytics can help identify these common scenarios.
Pricing
GTmetrix offers a free tier, but mobile testing requires a PRO subscription. Individual plans start at $4.25/month (Micro) and go up to $47.33/month (Growth). Business plans range from $72.50/month (Champion) to $510.00/month (Enterprise). All PRO plans include mobile testing, with higher-tier options offering extras like premium test locations and extended data retention.
Next: Learn how Google PageSpeed Insights handles mobile Core Web Vitals analysis.
4. Google PageSpeed Insights
Google PageSpeed Insights (PSI) is a free tool from Google that evaluates Core Web Vitals specifically for mobile devices. It combines real-world user data with controlled testing, offering a detailed look at how your site performs on mobile platforms.
PSI uses a simple 0–100 scoring system to rate performance. A score of 90 or higher means your site is performing well. Scores between 50 and 89 suggest room for improvement, while anything below 50 signals poor performance that needs immediate attention.
The tool pulls field data from the Chrome User Experience Report and pairs it with lab data from tests run on a Moto G4 device. It measures key metrics like Largest Contentful Paint (LCP), Interaction to Next Paint (INP), Cumulative Layout Shift (CLS), First Contentful Paint (FCP), and the experimental Time to First Byte (TTFB). To ensure it reflects real-world conditions, PSI focuses on the 75th percentile of user experiences, capturing the slower end of performance.
PSI also provides practical recommendations to improve page performance. These include suggestions like using WebP image formats, enabling lazy loading, minifying CSS and JavaScript, and optimizing caching strategies.
The tool evaluates individual pages and mostly relies on data from Chrome users, who account for 67% of the browser market as of January 2025. It's worth noting that PSI scores can vary depending on traffic patterns and device performance. Mobile devices often score lower due to factors like slower processors and resource-heavy CSS. This is particularly important because 40% of users abandon a page if it takes more than three seconds to load.
Google engineer Philip Walton highlights the importance of prioritizing real-world data:
"As a general rule, if you have both field data and lab data for a given page, field data is what you should use to prioritize your efforts. Since field data represents what real users are experiencing, it's the most accurate way to really understand what your users are struggling with and what needs to be improved."
Pricing
Google PageSpeed Insights is completely free. There are no hidden costs or premium features, making it accessible to businesses of any size.
Next: Learn how Chrome DevTools and Lighthouse offer powerful tools for developer-focused mobile testing.
sbb-itb-5be333f
5. Chrome DevTools and Lighthouse

Chrome DevTools and Lighthouse are powerful tools built into Chrome, designed to help you test and optimize mobile Core Web Vitals effectively.
Lighthouse is an open-source, automated tool available in Chrome DevTools. It evaluates web page quality across key areas like performance, accessibility, SEO, and best practices. For Core Web Vitals, Lighthouse focuses on metrics such as Largest Contentful Paint (LCP), Cumulative Layout Shift (CLS), and Total Blocking Time (TBT). These metrics are scored as follows: 90–100 is "good", 50–89 means "needs improvement", and 0–49 is considered "poor". The overall Performance score is a weighted average, with LCP and TBT playing a significant role in the calculation.
Mobile Device Simulation and Network Throttling
Chrome DevTools provides tools to simulate real-world mobile conditions. You can emulate mobile viewports and adjust network speeds using presets like "Fast 4G", "Slow 4G", or "3G" to replicate the types of connections your users might encounter. This kind of simulation is key to achieving Core Web Vitals targets.
Network recommendations rely on the 75th percentile round trip time, based on real-user data. As Rick Viscomi from Google highlights:
"Grounding your performance workflows in real-time local data and real-user data from the field can help you decide whether to invest more or less effort in debugging and optimizing a metric."
Actionable Testing Features
Chrome DevTools includes features that make optimizing Core Web Vitals straightforward. The Performance panel provides a timeline that flags critical moments, such as Layout Shift events. You can also disable specific network requests to see how they affect metrics like Total Blocking Time.
Lighthouse audits go a step further, pinpointing the elements impacting metrics like Largest Contentful Paint and Cumulative Layout Shift. It offers practical suggestions, such as preloading key images, lazy-loading offscreen images, and setting width and height attributes for media to prevent layout shifts.
For the most accurate testing, disable the cache in the Network panel to simulate a first-time visitor's experience. Enable device mode to emulate a mobile viewport and throttle the CPU to better reflect mobile performance. These tools work together to streamline the optimization process.
Performance Optimization Workflow
Chrome DevTools supports a step-by-step approach to performance improvement. As the documentation advises:
"Whenever you set out to optimize a site's load performance, always start with an audit. The audit establishes a baseline, and gives you tips on how to improve."
Tackle one change at a time and re-audit to measure its specific impact. Common fixes identified by Lighthouse include enabling text compression, resizing images properly, and deferring non-critical JavaScript and CSS to eliminate render-blocking resources.
Pricing
Free.
Next: Learn how the Top SEO Marketing Directory can connect you with specialized tools for Core Web Vitals optimization.
6. Top SEO Marketing Directory

The Top SEO Marketing Directory is your go-to resource for discovering and comparing tools that specialize in Core Web Vitals testing for mobile optimization. This platform bridges the gap between businesses and advanced SEO tools, focusing on technical performance and mobile-specific metrics. It serves as a valuable companion to the mobile testing tools mentioned earlier.
Simplified Tool Selection with Expert Insights
Choosing the right Core Web Vitals testing tool can feel like a daunting task, especially when dealing with challenges like fluctuating network speeds or diverse device capabilities. The directory simplifies this process by providing a curated list of SEO tools, paired with expert insights based on real-world results. This makes it easier to identify tools that align with your mobile optimization goals.
Bulk Testing and Premium Features
One standout feature of the directory is its access to premium tools that allow for bulk URL analysis. Forget the hassle of testing URLs one by one - these tools streamline the process by analyzing multiple pages at once. They also account for mobile-specific factors, such as slower simulated network conditions, which often result in lower performance scores.
Bridging Core Web Vitals and Technical SEO
The directory goes beyond just listing tools - it highlights how Core Web Vitals tie into broader technical SEO strategies. By connecting you with solutions designed to meet Google's Core Web Vitals and page speed requirements, it helps you stay competitive in mobile search rankings. These tools not only identify issues but also provide actionable steps to improve performance, ensuring your site is optimized for Google Mobile search.
Pricing
The directory offers flexible pricing options. Basic access is free, while Premium plans start at $49/month for enhanced features. Enterprise solutions are also available with custom pricing.
Whether you're looking for free tools or advanced premium solutions, the Top SEO Marketing Directory equips you with the resources to enhance your mobile optimization strategy effectively.
Tool Comparison Table
When choosing tools for mobile network simulation, data type, and pricing, it’s essential to understand what each one offers. Below is a summary of key features for popular tools:
| Tool | Mobile Network Simulation | Data Type | Pricing | Key Mobile Features |
|---|---|---|---|---|
| Sematext | 3G, 4G throttling options | Field and Lab | Starting at $5/month, free trial available | Real user monitoring with mobile-specific alerts |
| WebPageTest | 2G, 3G, 4G, custom bandwidth throttling | Lab data primarily | Free; premium plans start at $15/month | Bulk testing, premium mobile testing locations |
| GTmetrix | 3G, 4G simulation | Lab data primarily | Free; premium plans start at $10/month | Mobile testing requires premium account |
| Google PageSpeed Insights | Slow 4G connection simulation | Field and Lab | Free | Combines CrUX field data with Lighthouse lab data |
| Chrome DevTools/Lighthouse | 2G, 3G, 4G, custom throttling | Lab data | Free | Built-in mobile device emulation |
| Top SEO Marketing Directory | Access to tools with various network simulations | Varies by tool | Free basic access; premium starts at $49/month | Curated selection of mobile optimization tools |
Key Features and Differences
Network Simulation: Tools vary in the range of network conditions they simulate. For example, Google PageSpeed Insights focuses on slow 4G connections, while WebPageTest and Chrome DevTools allow custom throttling, covering 2G, 3G, and 4G speeds. These options are critical for testing and optimizing Core Web Vitals under diverse mobile network conditions.
Data Types: Tools like Sematext and Google PageSpeed Insights offer both field and lab data, providing a comprehensive view of performance. Field data reflects real user experiences, while lab data allows for controlled testing. As Google highlights:
"The data provided by Chrome User Experience Report offers a quick way to assess the performance of sites, but it does not provide the detailed, per-pageview telemetry that is often necessary to accurately diagnose, monitor, and quickly react to regressions".
Pricing: Pricing ranges from free options, like Google’s tools, to paid solutions with advanced features. Sematext starts at $5/month, offering real user monitoring, while WebPageTest’s premium plans ($15/month) include bulk testing and priority access to mobile testing locations. GTmetrix requires a premium account for mobile testing, and the Top SEO Marketing Directory provides access to various tools with premium plans starting at $49/month.
Why Combine Field and Lab Data?
For the best results in mobile performance optimization, using both field and lab data is crucial. Field data helps identify real-world user issues, while lab data is ideal for diagnosing and fixing problems before deployment. Tools that provide both types of data streamline the process, eliminating the need to switch between platforms. This dual approach ensures a more accurate and thorough optimization process.
Conclusion
Improving mobile Core Web Vitals requires a mix of tools to cover all aspects of testing. Each tool offers distinct advantages - some are better for real user monitoring, while others excel at providing detailed lab data for debugging. Hitting Google's Core Web Vitals benchmarks can lower page abandonment rates by 24%, which directly impacts your revenue.
To get the best results, combine field data (real-world user experiences) with lab data (controlled testing environments). This dual approach ensures you're working with accurate, actionable insights. Using both types of data simplifies mobile optimization and minimizes the hassle of switching between multiple platforms.
Since network simulation capabilities differ across tools, using more than one tool is often necessary for precise optimization. The Top SEO Marketing Directory can make this process easier. It consolidates advanced SEO tools and agency listings, offering a convenient way to find resources for improving mobile performance. With premium plans starting at $49/month, it’s a valuable resource for discovering tools tailored to your needs.
Don’t forget - regular monitoring is key to maintaining strong Core Web Vitals. Set up alerts and run periodic Lighthouse audits to catch performance issues before they affect your users. A steady testing routine using multiple tools will help you address immediate problems and track long-term trends effectively.
FAQs
How do Core Web Vitals affect mobile user experience and search rankings?
Core Web Vitals are essential for shaping the mobile user experience, focusing on three main aspects: loading speed, interactivity, and visual stability. These metrics determine how users perceive and interact with your site, playing a big role in satisfaction and whether they stick around.
On top of that, Core Web Vitals are a Google ranking factor. Websites that perform well in these areas are more likely to rank higher in mobile search results. Google prioritizes sites that offer fast, stable, and smooth experiences, so paying attention to these metrics can boost both your user experience and your site's visibility in search.
What’s the difference between field data and lab data when measuring Core Web Vitals?
Field data captures how real users experience your site under everyday conditions, using various devices and network setups. It offers a snapshot of your site's performance in the actual world.
Lab data, however, comes from controlled testing environments. By isolating variables, it pinpoints specific performance issues, though it doesn’t always mirror the experience of real users. Both are essential: field data reveals real-world performance, while lab data aids in troubleshooting and fine-tuning.
Why should I use more than one tool to test Core Web Vitals on mobile devices?
To thoroughly understand your Core Web Vitals performance on mobile, it’s smart to use a variety of tools. Each tool can simulate different network conditions, device types, or testing setups, potentially highlighting problems that a single tool might miss.
By comparing data across multiple tools, you can verify results, spot inconsistencies, and pinpoint areas that need attention. This ensures your site delivers a smooth experience for all mobile users.