Most local SEO reports miss the point: rankings do not pay the bills - closed revenue does. If I want to judge local SEO the right way, I need to track four things in order: visibility, engagement, qualified leads, and closed-won revenue.
Here’s the short version:
- I treat GBP impressions, local rank, and share of voice as top-of-funnel signals using specialized SEO tools
- I track website clicks, calls, and direction requests to measure engagement
- I count calls, form fills, bookings, and messages as leads - but only after filtering out spam, wrong numbers, and weak intent
- I use CRM data to separate raw leads from sales-ready leads
- I calculate CPL, CAC, close rate, revenue, and ROI to see whether local SEO is paying off
A few numbers stand out right away:
- 47% of GBP actions are website visits
- 38% are direction requests
- 15% are phone calls
- For many service businesses, median GBP click-to-action rate sits around 8% to 12%
That means if I only report on traffic or rankings, I’m leaving out the part that shows pipeline and cash flow.
The core idea is simple: local SEO should be measured like a revenue channel, not just a traffic source. That means clean UTM tagging, call tracking, CRM source fields, and location-level reporting that holds up from one storefront to a full portfolio.
If I had to start with the smallest useful setup, I’d use:
- Geo-grid share of voice
- GBP actions
- Qualified leads
- Closed-won revenue and CAC
From there, I’d set a 30-day baseline, clean up attribution, and compare local SEO against paid search on the same financial terms.
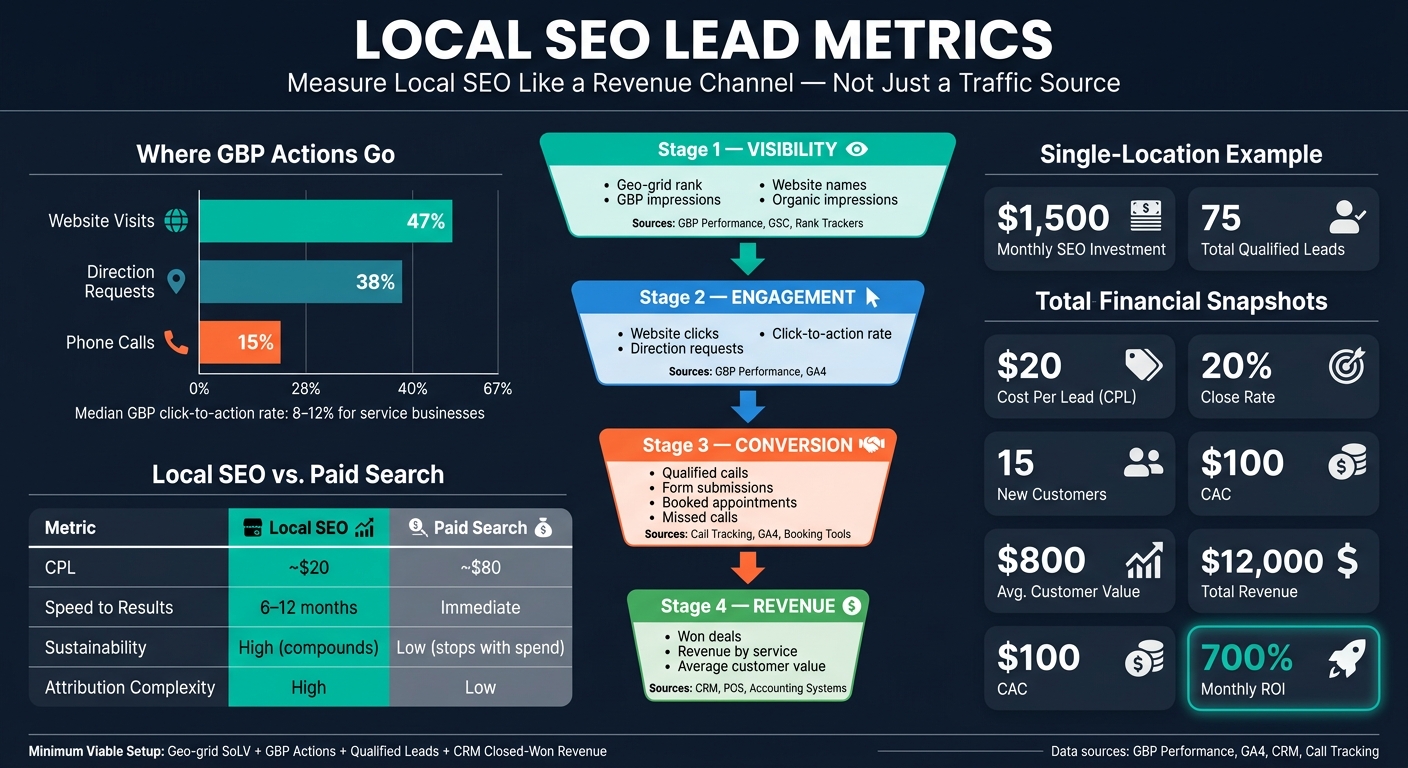
Local SEO Lead Metrics: From GBP Impressions to Closed-Won Revenue
Core Local SEO Lead Metrics and Their Data Sources
Visibility and Engagement Metrics
Visibility metrics show whether people can find you before they click. The two main ones are GBP impressions - split by Search and Maps - and local organic impressions from Google Search Console. To see how visibility shifts across your service area, pair impression data with geo-grid rank tracking. Tools like Local Falcon or BrightLocal show where visibility fades by location, not just from a single office address.
Engagement metrics come next. They show what people do after they find you. Inside the GBP Performance dashboard, you can track website clicks, direction requests, and GBP calls. For service businesses, the median click-to-action rate falls between 8-12%. That gives you a solid baseline when a listing starts lagging.
One data issue trips up a lot of teams: GBP website clicks often show up in GA4 as "direct" or generic organic traffic unless you add UTM parameters to the website URL in your profile. Add those UTM parameters so GA4 can split GBP traffic from standard organic sessions.
Lead, Pipeline, and Revenue Metrics
After engagement, focus on actions that turn into pipeline. That usually means qualified calls, form submissions, and booked appointments. Call tracking tools like CallRail and WhatConverts help sort out spam and wrong numbers by using source attribution, call duration, and first-time caller status. Missed calls need their own field as well. They reflect demand SEO created that the business failed to catch.
| Funnel Layer | Primary Metrics | Data Source |
|---|---|---|
| Visibility | Geo-grid rank, GBP impressions, organic impressions | GBP Performance, GSC, Rank Trackers |
| Engagement | Website clicks, direction requests, click-to-action rate | GBP Performance, GA4 |
| Conversion | Qualified calls, form submissions, booked appointments, missed calls | Call Tracking, GA4, Booking Tools |
| Revenue | Won deals, revenue by service, average job value | CRM, POS, Accounting Systems |
Form submissions and booked appointments should flow into your CRM as opportunities. From there, won deals, total revenue per location, and average customer value tie local SEO to money in the bank. Revenue attribution only works when CRM data includes source attribution. And for multi-location brands, you need a master location identifier that links GBP location IDs to CRM store IDs. If that mapping is missing, attribution falls apart fast.
Tools to Collect and Report Local SEO Lead Data
The basic free SEO marketing services setup - GBP Performance, Google Search Console, and GA4 - covers visibility through on-site conversion at no cost. Paid tools handle the gaps. BrightLocal costs $39 to $239 per month and covers geo-grid tracking. CallRail and WhatConverts handle call attribution and lead qualification. HubSpot, Salesforce, and GoHighLevel connect that data to pipeline and revenue.
One thing to watch: GBP API history is capped at 18 months. If you want year-over-year reporting, export and store the data in BigQuery.
The reporting setup should match the business model. A single-location business usually needs a simple scorecard. A multi-location brand needs roll-up reporting across locations.
sbb-itb-5be333f
How I Track Local SEO Performance for my Clients
Tracking these metrics effectively requires the right stack, such as specialized SEO tools for small businesses that streamline data collection.
How to Build Local SEO Reporting for Single and Multi-Location Brands
Use the funnel above to match the right metrics to the right reporting view.
Single-Location Scorecards and Diagnostics
A single-location business needs two views: a weekly diagnostic view and a monthly scorecard that tracks performance from visibility to revenue.
On a weekly basis, watch geo-grid rank movement, GBP action trends, review growth and velocity, lead volume, and any unauthorized profile edits. Treat these as cadence signals, not as stand-alone metric definitions. Monthly, step back and review a full KPI snapshot that runs from visibility through revenue. In Google Search Console, split branded and non-branded queries. Branded growth shows existing demand. Non-branded growth shows new discovery.
Only segment by device and landing page type when conversion rates are different enough to matter. For a simple reporting rhythm, compare GBP calls, directions, and website clicks over a rolling 3-month window.
The same metric layers work for multi-location reporting. What changes is the roll-up.
Multi-Location Rollups for Franchises, Chains, and PE-Backed Portfolios
Multi-location reporting needs three views: executive, regional, and location-level.
The same funnel applies at each location. Only the roll-up changes. Executives need to see portfolio ROI and risk. Regional leaders need market comparisons and competitor gaps. Location managers need calls, reviews, and geo-grid visibility. If you skip that structure, blended averages can hide locations that are slowly losing ground.
Standardize these fields across systems:
location_idmarketregionbrandfunnel_stagerevenue
These fields make roll-ups possible and keep market comparisons consistent.
Show missed calls as lost revenue. Also flag unverified profiles, missing UTMs, broken call routing, and unanswered reviews as reporting failures. These are measurement integrity problems. Missing UTMs, broken routing, and unverified profiles can throw off lead attribution across the whole model. Add a data-completeness KPI so broken attribution is easy to spot.
Dashboard and Stack Options by Reporting Complexity
The right stack depends on how many locations you manage and how closely you need to tie SEO to revenue. The table below maps common use cases to the level of reporting depth that fits.
| Use Case | Metrics Covered | Integration Depth | Pros | Cons |
|---|---|---|---|---|
| Single-Location | GBP Actions, GSC Queries, GA4 Leads | Basic (GA4 + GSC + GBP) | Low cost, easy setup | Lacks geographic depth |
| Multi-Location (Mid-Market) | Geo-grid, Review Sentiment, Regional Rollups | Moderate (API-based dashboards) | Surfaces market patterns | Requires specialized local SEO tools |
| Enterprise Portfolio | ROI by Market, Data Integrity, CRM Pipeline | High (CRM + BI + Master Data) | Connects SEO to revenue | High complexity/cost |
For larger multi-location teams, GoHighLevel can handle pipeline tracking and source attribution at the location level. HubSpot and Salesforce fit higher-volume operations with dedicated staff. Pick the simplest stack that still connects leads to revenue and CAC.
Connecting Local SEO Leads to CAC, Revenue, and ROI
Once leads are in the door, the next step is simple: tie them to CAC, revenue, and ROI. Rankings and Google Business Profile (GBP) actions don't mean much on their own. They need to connect to dollars.
The Formulas That Matter
Use clean inputs from your CRM, POS, and accounting systems.
| Metric | Formula | Data Source |
|---|---|---|
| Cost Per Lead (CPL) | Total SEO Spend ÷ Total Qualified Leads | Accounting + GA4/Call Tracking + GBP |
| Customer Acquisition Cost (CAC) | Total SEO Spend ÷ New Customers Acquired | Accounting + CRM |
| Close Rate | Closed Deals ÷ Qualified Leads | CRM |
| Revenue from Local SEO | New Customers × Avg. Customer Value | CRM + POS/Accounting |
| Local SEO ROI | (Revenue − SEO Investment) ÷ SEO Investment | CRM + Accounting |
A low close rate usually points to a sales or ops problem, not an SEO problem.
Attribution from Impression to Closed Deal
The job here is to follow the lead from source all the way to Closed-Won revenue without dropping the trail. That's harder than it sounds. A GBP interaction can turn into a phone call, a form fill, a walk-in, and then a sale days later.
To connect those dots, your UTM parameters, call tracking numbers, and CRM source fields need to work together.
Tag GBP links with UTMs, use DNI for landing pages, and pass form, chat, and booking sources into CRM. Send GA4 form, chat, and booking events into CRM source fields so the original lead source stays attached to the deal through Closed-Won and revenue. If someone requests directions and later buys in-store, count that as a partial-credit conversion.
It also helps to clean the data before you run the math. Audit untracked calls, duplicate leads, and walk-ins with no digital trail using top SEO tools and resources. Filter spam calls and duplicates out of your call-tracking software before calculating ROI - if you don't, performance will look better than it is.
Financial Reporting Examples and Channel Comparison
Here's a simple example for a single-location service business. Start at one location first, then roll results up across the portfolio.
| Input / Output | Value | Source |
|---|---|---|
| Monthly SEO Investment | $1,500 | Accounting Records |
| Total Qualified Leads | 75 | Calls + Forms + Bookings |
| Cost Per Lead (CPL) | $20 | $1,500 ÷ 75 |
| Close Rate | 20% | CRM |
| New Customers | 15 | 75 × 20% |
| CAC | $100 | $1,500 ÷ 15 |
| Avg. Customer Value | $800 | POS/Accounting |
| Total Revenue | $12,000 | 15 × $800 |
| Monthly ROI | 700% | ($12,000 − $1,500) ÷ $1,500 |
That math gives you a clean read on unit economics. Spend $1,500, bring in 75 qualified leads, close 15 customers, and produce $12,000 in revenue. In plain terms, that's the kind of link operators want to see between local SEO and cash flow.
The channel comparison tells a similar story:
| Metric | Local SEO | Paid Search (LSA/PPC) |
|---|---|---|
| CPL (Illustrative Range) | ~$20 | ~$80 |
| Speed to Results | 6–12 months for measurable ROI | Immediate |
| Sustainability | High - authority compounds over time | Low - leads stop when spend stops |
| Attribution Complexity | High (zero-click, calls, walk-ins) | Low (direct click-to-lead) |
Local SEO can produce lower CPLs, but it takes longer to show measurable ROI. Paid search moves faster, but spend has to stay on to keep leads coming. That's the tradeoff.
Conclusion: The Minimal Measurement Model to Start With
Start with a small model that gives you useful signal: (you can use SEOptimer for initial site audits) visibility, engagement, qualified leads, and CRM-tracked closed-won revenue.
Use this as the baseline report:
| Funnel Layer | Primary Metric | Data Source |
|---|---|---|
| Visibility | Geo-grid Share of Voice (SoLV) | Local rank tracker |
| Engagement | GBP Actions (calls, directions, clicks) | GBP Performance |
| Conversion | Qualified Leads (forms, calls, bookings) | GA4 + call tracking |
| Revenue | Closed-Won Revenue & CAC | CRM |
Before you change anything, set a 30-day baseline for SoLV, GBP actions, and lead volume.
The most common gap is simple: no clear lead definition. Define a qualified lead as a connected call, completed form, or confirmed booking. Once that’s locked in, close rate, CAC, and ROI become consistent.
After those four inputs are clean, you can line up local SEO against other channels using the same financial yardstick. Local SEO tends to build over time - more trust and more visibility can bring CAC down. So don’t treat it like a traffic source. Treat it like a revenue channel measured against CAC.
FAQs
How do I define a qualified local SEO lead?
A qualified local SEO lead is more than an interaction count. It fits your criteria for service, location, and intent - and it points to a real revenue opportunity in your CRM.
Track only qualified events:
- connected calls, not spam or misdials
- valid form submissions
- booked appointments
Use call quality, form quality, and click-to-action rate to tell true leads apart from vanity metrics.
What is the minimum setup to track local SEO revenue?
At the bare minimum, tie local SEO visibility to business results. Add UTM parameters to your Google Business Profile links so visits show up properly in GA4. Then set up key conversion events for phone clicks, form submissions, and appointment bookings.
It also helps to keep a simple monthly KPI sheet. Dashboards change, and not always when you want them to. A basic sheet gives you a clear way to connect organic traffic and map-based traffic to actual sales leads.
How long does local SEO usually take to show ROI?
Local SEO often takes a few months to show its full ROI. There’s usually a gap between the work you do now and the leads, calls, or sales that come from it later.
That said, you can still spot early signs within a few weeks if you track engagement metrics. Those early numbers can help you find trends, catch leaks, and see whether things are moving in the right direction.
Just don’t expect early ROI math to tell the whole story. Local SEO builds over time, so steady monitoring helps you tell the difference between short-term swings and growth that lasts.