If your pages ship JavaScript that users never need, you’re paying for it with slower load times and weaker interaction. I’d start by measuring unused bytes, long tasks, and bundle weight - then I’d check 9 common problem areas: framework bloat, tag managers, dead libraries, widget overlap, old polyfills, duplicate packages, release controls, tool setup, and team ownership.
A few numbers make the case fast:
- 60% to 70% of shipped JavaScript often goes unused
- Long tasks over 50 ms can hurt interaction
- A good target is LCP under 2.5 seconds
- A good target is INP under 200 ms
- Even 100 KB of extra gzipped JavaScript can add noticeable delay on mobile
Here’s the short version: I’d first find what’s unused with Chrome DevTools Coverage, then cut the biggest sources of waste, then stop the problem from coming back with CI budgets and a script review process.
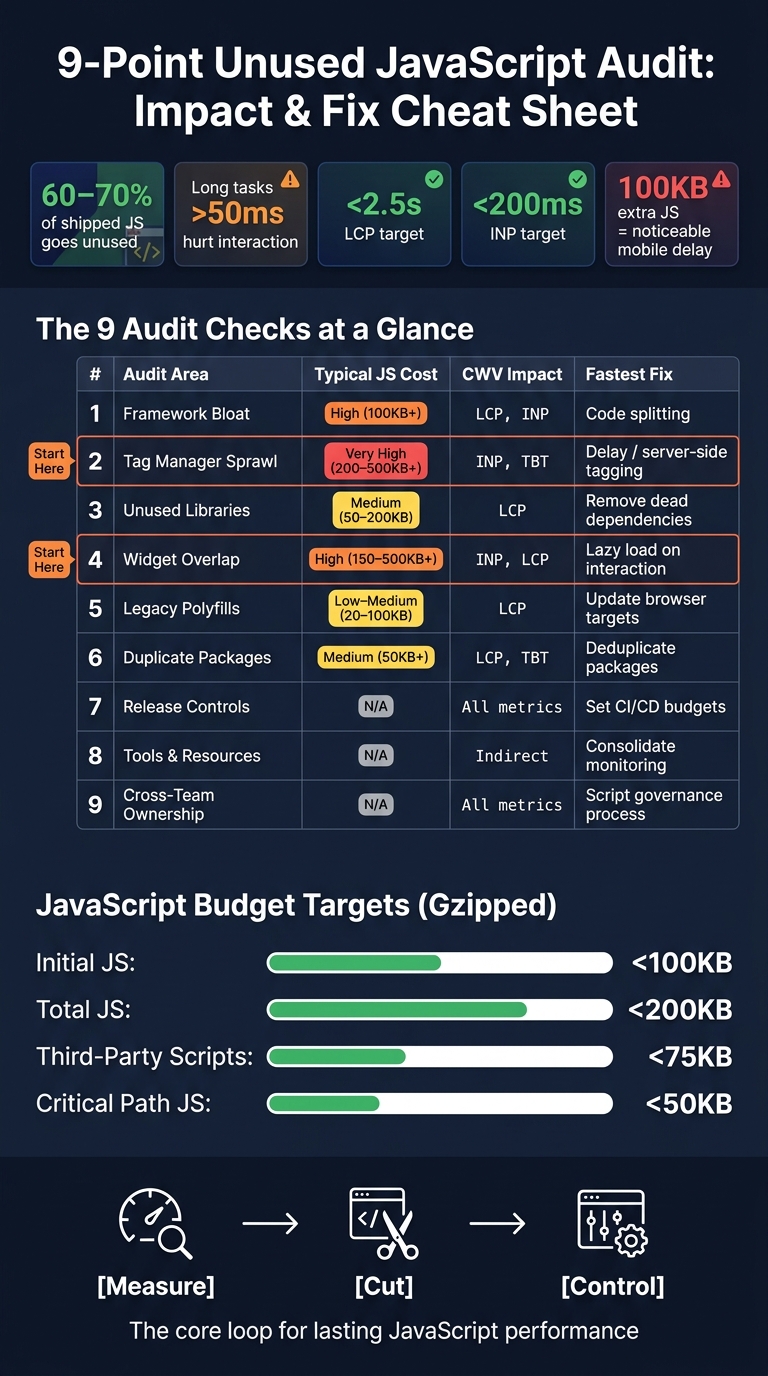
9-Point Unused JavaScript Audit: Impact & Fix Cheat Sheet
How to Reduce Unused JavaScript
sbb-itb-5be333f
Quick comparison
| Check | What I’d look for | Main risk | First fix |
|---|---|---|---|
| 1. Framework bloat | Large route-wide bundles | INP, LCP | Code splitting |
| 2. Tag manager sprawl | Too many third-party tags | INP, TBT | Delay or remove tags |
| 3. Unused libraries | Old packages still shipped | LCP | Remove dead deps |
| 4. Widget overlap | Chat, replay, reviews stacked together | INP, LCP | Load on interaction |
| 5. Legacy polyfills | Old browser support code | Parse/compile cost | Update browser targets |
| 6. Duplicate packages | Two versions of same library | TBT, LCP | Deduplicate |
| 7. Release controls | No JS budget in CI | Regressions | Fail builds on overages |
| 8. Tools and resources | Weak monitoring | Drift over time | Use audit + bundle tools |
| 9. Cross-team ownership | No owner for scripts | Script creep | Keep a script inventory |
What I like about this audit is that it’s not just about file size. It’s about main-thread work. If the browser has to download, parse, and compile code that never helps the user, the page can feel slow even on a decent connection.
So if I were auditing a site today, I’d do this in order:
- Record baseline metrics first
- Fix third-party scripts and widgets before small library swaps
- Trim route-level bundle bloat
- Remove old polyfills and duplicate packages
- Lock in limits with CI and team rules
That gives you a simple path: measure, cut, and control.
Baseline Metrics to Capture Before the Audit
Record your baseline metrics before you change any code. If you skip this step, you won't be able to show whether the audit improved UX or traffic. Get these numbers first, then compare each audit check against them.
Start with total JavaScript size, executed vs. unused bytes, parse and compile time, long tasks, and differences across page templates. For executed vs. unused bytes, use the Chrome DevTools Coverage tab: open DevTools with Ctrl+Shift+I, go to More tools > Coverage, then reload the page. You'll see a red/green view of unused vs. executed code. On many pages, 60% to 70% of shipped JavaScript goes unused.
Long tasks are any JavaScript execution blocks over 50 ms. They lock up the browser and hit interaction metrics hard, so track them in the DevTools Performance panel.
Measure each main template on its own. Home, product, pricing, checkout, and blog pages almost never ship the exact same JavaScript. Do this for both mobile and desktop as well. A script that compiles in 100 ms on a laptop can take 500 ms or more on a mobile device. It's a good idea to pair lab data from Lighthouse or DevTools with field data from CrUX or Google Search Console.
| Metric | Good Threshold | Tool |
|---|---|---|
| Interaction to Next Paint (INP) | < 200 ms | PageSpeed Insights (Field), DevTools |
| Largest Contentful Paint (LCP) | < 2.5 s | PageSpeed Insights, Lighthouse |
| Total Blocking Time (TBT) | < 200 ms | Lighthouse, WebPageTest |
| Long Tasks | > 50 ms | Chrome DevTools Performance Panel |
| Unused JS Percentage | Aim for < 20% | Chrome DevTools Coverage Tab |
| Time to First Byte (TTFB) | < 800 ms (aim for < 200 ms) | WebPageTest, DevTools Network Tab |
Before making any cuts, record organic clicks, impressions, and Core Web Vitals status groups in Google Search Console. That's the baseline that lets you tie JavaScript reductions back to ranking and traffic results. Use it to rank the nine checks that follow.
1. Framework Bloat in Main Bundles
Start with the main bundle. That’s usually where the most unused code sits - and where INP problems often begin. Use your coverage data to see which framework chunks ship the most code users never touch. On a mid-range Android phone, a 500 KB gzipped bundle can take 3.2 seconds to parse, versus 0.15 seconds on a high-end MacBook. That gap matters. Desktop testing can make things look fine while mobile users take the hit.
Audit framework and page-builder assets first, since they often load across the whole site. CMS page builders can be a big source of waste too. Elementor, for example, can load widget assets sitewide even when a page doesn’t use any of them. Turn on Optimized Asset Loading in Elementor. In custom builds, use React.lazy() or Next.js dynamic() to split code by route. Once route-based splitting is in place, look at tag managers and third-party scripts to see what extra weight they add.
Then trim library weight you don’t need. Swap heavy default packages for smaller imports or native browser APIs. And skip barrel imports when you only need one function - otherwise you can end up pulling in an entire directory for a tiny job.
| Bloated dependency | Gzipped Size | Smaller replacement | Alternative Size |
|---|---|---|---|
| Moment.js | ~72KB | date-fns (tree-shaken) | ~8KB |
| Lodash (full) | ~70KB | Lodash (cherry-picked) | ~2KB |
| Apollo Client | ~47KB | urql | ~14KB |
| Axios | ~14KB | Native fetch |
0KB |
| Redux Toolkit | ~12KB | Zustand | ~1KB |
Set a gzipped initial-bundle budget in CI/CD so bundle growth fails the build. Then move to tag manager sprawl and third-party scripts.
2. Tag Manager Sprawl and Third-Party Scripts
After the main bundle, tag managers are often the next big source of wasted JavaScript. And in most cases, the bigger cost comes from the tags that GTM loads - not the GTM container itself.
The average site loads 30+ third-party scripts, and those scripts make up 60%+ of JavaScript execution time. On top of that, 89% are render-blocking. That’s a lot of code fighting for browser time before the page can settle down.
Some tools are worse than others. Session-replay and heatmap tools are often the heaviest offenders because they keep watching DOM mutations in the background. Heatmap tools alone often add 200-400 KB of JavaScript.
The fix starts with cleanup. Remove dead tags, tighten triggers, and delay anything that doesn’t need to load right away. In GTM, use firing reports to spot tags with zero fires over a span of several weeks. Then use Preview mode to check which tags fire on each template. This tends to surface the usual mess: old pixels, duplicate tracking, and tags that run site-wide for no good reason.
Trigger scope matters too. A conversion pixel should fire on the order confirmation page, not across the whole site. Heavy widgets should load only after user interaction or when they enter the viewport with Intersection Observer. Server-side tagging can also help by shifting work to a server container, which cuts client-side requests and lowers main-thread load. Less main-thread work usually means better INP and less risk to LCP.
To check impact, open Chrome DevTools, right-click any third-party script, select "Block request domain," and reload the page.
| Script Category | Impact | Primary Metric Affected |
|---|---|---|
| Analytics (GA4) | Lightweight | Minimal impact if async |
| Remarketing Pixels | Variable; often adds network requests | LCP, network contention |
| Session Replay | Heavy; high main-thread usage | INP, TBT |
| Consent Tools | Moderate; blocks other tags if slow | LCP, FCP |
| A/B Testing | Heavy; can block rendering | LCP, TBT |
If tag cleanup still leaves too much JavaScript, the next step is to audit unused libraries and dead dependencies.
3. Unused Libraries and Dead Dependencies
Unused JavaScript still gets downloaded, parsed, and compiled - even if none of it ever runs. Dead libraries do the same thing. So the next job is simple: find the package, tag, or import that still drags that code onto the page.
A common cause is libraries that stuck around long after their job was done - old jQuery, Bootstrap, or Lodash builds are classic examples. A good place to spot them is the Coverage tab in Chrome DevTools. Open DevTools, go to More tools > Coverage, then record a page load. The red bars show bytes that never executed. After that, check the Network panel and look at the Initiator column. That tells you whether the dead library comes from your own code or from another script that pulls it in behind the scenes.
Once you find a likely culprit, don't delete it and hope for the best. Remove it in a staging build first and confirm that nothing breaks.
On the build side, use ES Module syntax so bundlers like Rollup and Webpack can tree-shake unused exports on their own. Setting "sideEffects": false in package.json also helps the bundler cut modules whose exports are never referenced. After you remove dead packages, check page widgets too. It's common to find multiple widgets doing the same job with different scripts.
4. Widget Overlap and Redundant Embeds
Widget creep starts when different teams keep adding tools to the same page. Marketing installs chat. Sales adds a feedback popup. Product brings in session replay. Before long, one template is doing the work of three. The audit question is straightforward: which embeds does this page actually need, and which ones are doing the same job twice?
When widgets stack up, they add more main-thread work and push up INP risk. A live chat widget can add 500 KB+ of JavaScript. Heatmaps and session-replay tools get expensive fast when they sit alongside chat, social feeds, or review widgets. And long tasks over 50 ms can hurt INP.
| Widget Category | Size | Impact |
|---|---|---|
| Live Chat | 500 KB+ | High (iframes, listeners) |
| Heatmaps/Session Replay | 200–400 KB | High (DOM observation) |
| Social Feeds | 300 KB+ | Medium (network/rendering) |
| Reviews | ~150 KB | Low–Medium |
| Analytics/Pixels | Variable | Low–Medium |
After you remove overlap, the next step is timing. Nonessential widgets should wait until the user is likely to need them. For offscreen widgets, a practical move is lazy loading with the Intersection Observer API - the widget loads only when it scrolls into view. For non-critical tools like chat, use load on interaction: hold the script until the user scrolls, taps, or clicks. That keeps the first load lighter without cutting the tool completely.
Tag Manager containers need a close review too. It’s common to see one purchase event fire both GA4 and a legacy pixel, which means the same tracking runs twice. A cleaner setup is one dataLayer event that multiple tags listen to. That cuts duplicate firing without losing tracking.
On WordPress sites, scope scripts to the pages that need them. Use conditional tags like is_page() so a Reviews script loads only on review pages.
Once widget scripts are scoped the right way, check whether legacy polyfills are still shipping sitewide.
5. Legacy and Excessive Polyfills
Polyfills were built to fill gaps in older browsers - things like fetch, Promise, or Array.prototype.includes. The problem is that many sites still send those patches to browsers that don't need them anymore. That's legacy compatibility debt. It makes your shipped JavaScript bigger without doing anything for people on current browsers.
The main hit isn't just file size. It's parse and compile time. Even unused polyfills take up main-thread time, which can slow down interaction. Polyfills kept around for browsers like IE 11 can add 50 KB to 100 KB of dead weight to a bundle that current browsers still download, parse, and compile for no reason.
The next place to check is your polyfill target list. Review @babel/preset-env and browserslist. Remove old targets like IE 11 only after field data shows they're no longer needed. In plain English: look at the browsers your visitors actually use before you cut support.
Once your targets are cleaned up, split modern and legacy bundles. That way, current browsers skip legacy polyfills entirely instead of paying the cost for old patches they don't need.
Keep your eye on what modern browsers still download. Those are the bytes hurting first-load performance now. If you've already trimmed polyfills, the next thing to check is duplicate and overlapping packages.
6. Duplicate and Overlapping Packages
Even after you remove dead libraries and unused widgets, duplicate versions can still slip into the bundle. That adds extra bytes and extra main-thread work. In plain terms, two dependencies can pull in different versions of the same library, so users end up downloading, parsing, and executing the same code twice for no gain.
Those duplicate bytes can increase TBT and delay LCP. PageSpeed Insights includes a "Duplicated JavaScript" insight that points to code loaded more than once. Chrome DevTools' Coverage tab helps you see how much of a large library actually runs. And at the build level, Rollup's generateBundle can output a module manifest so you can check which packages made it into the final bundle. The goal is simple: make sure only one version of each major dependency ships.
A couple of practical fixes:
- In WordPress, remove extra handles with
wp_dequeue_script(). - In Rollup, use
manualChunksandgenerateBundleto surface duplicate vendor code.
After deduping packages, add release checks that block bundle growth before it ships.
7. Release and Regression Controls for JavaScript Size
After you cut dead code, duplicate packages, and third-party bloat, the next job is simple: keep it from coming back. Once unused JavaScript is gone, enforce bundle budgets in CI so regressions fail before merge - surfacing regressions in pull requests before merge.
Start with clear limits. A practical 2026 baseline is:
| Budget Category | Recommended Limit (Gzipped) |
|---|---|
| Initial JavaScript | < 100 KB |
| Total JavaScript | < 200 KB |
| Third-Party Scripts | < 75 KB |
| Critical Path JS | < 50 KB |
That means initial JavaScript should stay under 100 KB gzipped, and all shipped JavaScript per page should stay under 200 KB gzipped. Third-party scripts need their own cap at 75 KB gzipped. Keep these limits tight enough to protect mobile INP.
Then automate enforcement. If the budget is just written in a doc, it won't hold. If it's wired into CI, the build can fail the moment a bundle crosses the line.
A few common ways to do that:
- The
size-limitnpm package lets you set thresholds in a config file and fail the CI run when a file goes over budget. - Webpack users can set
performance.hintsto"error"and usemaxAssetSizeto stop the build when an asset gets too large. - Lighthouse CI can gate LCP ≤ 2,500 ms, CLS ≤ 0.1, and TBT ≤ 200 ms on production builds.
Run checks on production builds, not local dev builds. And don't rely on a single run. Test 3 to 5 times and gate on the median.
After release controls are in place, the next step is choosing the right tools to keep JavaScript lean over time.
8. Tools and Resources for Ongoing JavaScript Optimization
Use these tools to check the nine items above and catch regressions before they hit production.
Chrome DevTools Coverage works best for spot checks on specific templates or scripts. It shows live execution data, which makes it useful for narrow investigations instead of long-term tracking.
For page-level impact, step back from code inspection and look at performance scoring. Lighthouse and PageSpeed Insights can flag unused JavaScript and show whether it affects LCP and INP. Use Lighthouse for lab testing. Use PageSpeed Insights when you want lab data plus field validation.
webpack-bundle-analyzer shows your production bundle as an interactive treemap, so it’s easy to see bundle growth before release. When you judge impact, focus on what the browser still has to parse and compile. If you use Vite or Rollup, similar visualizer plugins rely on ES module static analysis to show which exports stay in the final build.
Use the matrix below to pick the right tool for the job:
| Tool | Best For | Data Type |
|---|---|---|
| Chrome DevTools Coverage | Line-by-line execution analysis | Lab (live) |
| Lighthouse / PageSpeed Insights | Identifying unused bytes and Core Web Vitals impact | Lab + field |
| webpack-bundle-analyzer | Visualizing bundle composition | Build-time |
| WebPageTest | Global testing and filmstrip views | Lab |
| Google Search Console | Long-term Core Web Vitals tracking | Field |
The Core Web Vitals report in Google Search Console tracks real-user performance over a 28-day rolling window. Review it once a month for regressions. It’s a simple way to spot JavaScript-related drops in real-user data.
9. Cross-Team Ownership Across Marketing, Product, and Engineering
After cleanup, ownership is what stops unused JavaScript from creeping back in.
Most of the time, unused JavaScript doesn’t return because of one big mistake. It comes back little by little through script adds that no one fully owns. Marketing adds analytics. Sales adds a chat widget. Product adds feature flags. Each add can seem small on its own, but the total grows fast when no team is tracking the cost.
The main control here is a script inventory. Keep one record of every script and note its purpose, requesting team, size, and performance impact using SEO marketing tools. Without that record, old campaign tags and forgotten tools turn into hidden script debt. That debt adds risk and page weight, and no one sees it clearly until performance slips.
You also need a cross-functional review group with people from engineering, marketing, and product. That group should review every new script request. Ask for a short business case, include the expected performance cost, and set clear rules for what needs review, what can ship without review, and who makes the final call. New scripts should be checked against the same bundle and INP budget used in release gates.
Set a monthly review to remove stale campaign tags before they pile up. Then run a deeper quarterly audit to cut redundant marketing pixels, unused plugins, and legacy tools. Approved script changes should still go through the current CI checks. Manual review catches intent. Automated gates catch accidents.
"We had 51 apps on our Shopify store... Twenty-two of them were doing things Shopify native features now handle out of the box... We cut to 29 apps, saved $1,400 a month, and our Lighthouse score went from 54 to 81." - Cara Nguyen, Director of Ecommerce, Hatch Home Goods
Use this ownership model to guide the checks in the summary table that follows.
Audit Summary Table
Use the table below to rank the nine checks by impact. In most cases, Checks 2 and 4 should be at the top of the list because third-party scripts and widgets tend to add the most weight and the most main-thread work. Typical JS Cost and Likely CWV Impact help you sort fixes fast and decide where to start.
| # | Audit Area | How to Detect | Typical JS Cost | Likely CWV Impact | Fastest Fix |
|---|---|---|---|---|---|
| 1 | Framework Bloat | Chrome DevTools Coverage Tab | High (100KB+) | LCP, INP | Code splitting / tree shaking |
| 2 | Tag Manager Sprawl | Lighthouse third-party audit / GTM Preview Mode | Very High (200KB–500KB+) | INP, TBT | Delay execution / server-side tagging |
| 3 | Unused Libraries | Chrome DevTools Coverage Tab | Medium (50KB–200KB) | LCP | Remove dead dependencies |
| 4 | Widget Overlap | Network panel filtered by domain | High (150KB–500KB+) | INP, LCP | Lazy load on interaction |
| 5 | Legacy Polyfills | Lighthouse Legacy JavaScript audit | Low–Medium (20KB–100KB) | LCP | Update browser build targets |
| 6 | Duplicate Packages | Webpack or Vite Bundle Analyzer | Medium (50KB+) | LCP, TBT | Deduplicate via package manager |
| 7 | Release and Regression Controls | Lighthouse CI / CI logs | N/A | All metrics | Set performance budgets in CI/CD |
| 8 | Tools and Resources | Tooling inventory / monitoring | N/A | Indirect | Consolidate monitoring and alerts |
| 9 | Cross-Team Ownership | Script inventory review | N/A | All metrics | Establish a governance review process |
A simple way to think about it: 2 and 4 usually drive the first round of work, while 7, 8, and 9 help keep the site from sliding back. Once you’ve ranked the checks, use the tools in the next section to confirm the main offenders and hold onto the gains.
Recommended Tools and Resources
Use the tools below to verify all nine checks as part of a technical SEO audit and catch regressions before release. The goal is simple: match each tool to the job it does best.
Use Chrome DevTools for execution tracing. Coverage shows unused bytes, Network Initiator helps you trace script chains, and Performance helps you spot long tasks.
Use Lighthouse and PageSpeed Insights to flag unused JavaScript and show how it affects Core Web Vitals.
Use webpack-bundle-analyzer, Vite/Rollup visualizers, or @next/bundle-analyzer to spot framework bloat, dead dependencies, and duplicate packages before release.
TagScope uses Playwright to trace marketing tags, dataLayer events, and GA4 requests. GTM Preview Mode and Tag Assistant help identify redundant or non-firing pixels.
Use DeployHQ and the PageSpeed Insights API to run automated checks on live mobile and desktop URLs.
The table below maps each tool category to the audit work it supports.
| Tool Category | Recommended Tools | Best For |
|---|---|---|
| Browser Debugging | Chrome DevTools (Coverage, Network, Performance) | Real-time unused code and script tracing |
| Automated Auditing | Lighthouse, PageSpeed Insights | Core Web Vitals benchmarking and opportunity flags |
| Bundle Analysis | webpack-bundle-analyzer, Vite/Rollup visualizers, @next/bundle-analyzer |
Build-time dependency and bloat inspection |
| Tag Auditing | TagScope, GTM Preview Mode, Tag Assistant | Marketing pixel and firing redundancy checks |
| Regression Monitoring | DeployHQ, PageSpeed Insights API | Catching performance regressions post-deployment |
| SEO Resources | Top SEO Marketing Directory | Finding agencies and software for technical SEO and Core Web Vitals work |
You can also use Top SEO Marketing Directory to find technical SEO tools, software, and agencies.
Use this stack to verify Checks 1 through 9 and maintain the gains after release.
Conclusion
Unused JavaScript builds up over time. That means the fix can't be one-and-done. You need a system: audit what you ship, cut what you don't need, and control every new script that gets added.
The nine checks in this audit cover the most common trouble spots - framework bundles, tag manager sprawl, duplicate packages, and old polyfills. Left alone, each one adds weight. Put together, they can slow a site down more than most teams expect.
The payoff is measurable. Real sites often see faster load times and stronger conversions after removing unused JavaScript.
Set a hard JavaScript budget in CI/CD and block releases that go past the limits already defined in your audit. Give every script a clear owner. Then run this as a quarterly review: marketing checks tags, product checks active features, and engineering checks bundle size.
FAQs
How often should I run this audit?
Run the unused JavaScript audit on a regular schedule - after major releases and any time you add or remove tags, widgets, or third-party libraries.
For day-to-day upkeep, make it part of your monthly or quarterly performance reviews. Then check again after each deployment. It also helps to review plugins and tags after launch, test changes in staging, and watch performance once those changes go live.
Which pages should I audit first?
Start with plugins and extensions. They often add the most unused code.
Remove anything inactive or duplicated. If one tool does five different jobs but you only use one, swap it for a lighter, single-purpose option. That alone can trim a lot of dead weight.
Then check your biggest JavaScript files and third-party scripts with Chrome DevTools Coverage. If you need a closer look, use WebPageTest or a bundle analyzer. And before you change anything on the live site, test it on a staging site first.
How do I know if a script is safe to remove?
Start with an inventory. Document what each script does and what it adds to the business.
If a script has low value and low impact, it may be safe to remove. Use Chrome DevTools to trace what loads it and check its performance impact.
Also, check dependencies first. If you remove a required script, you can break features and trigger console errors. Before you remove anything, test in staging across different user states, like logged-in and logged-out sessions.