If I had to cut this list down fast, I’d use three picks to cover most needs: PageSpeed Insights for a free baseline, WebPageTest for deep lab debugging, and SpeedCurve or DebugBear for monitoring over time.
Here’s the short version: this article compares 10 page load time tools by data source, metrics, test locations, pricing, and monitoring. The main split is simple - some tools use lab data, some use field data, and some give you both. That one difference changes how useful the tool is for SEO, debugging, and reports.
If you want the fastest way to choose:
- Free checks: Google PageSpeed Insights
- Developer lab tests: Google Lighthouse
- Deep waterfall analysis: WebPageTest
- Simple scheduled reports: GTmetrix
- Uptime + speed in one place: Pingdom
- Trend tracking over time: SpeedCurve
- SEO audits with speed checks: Semrush Site Audit
- Element-level debugging: DebugBear
- Google field data only: CrUX
- App + browser monitoring: New Relic Browser
One fact matters most: Google’s Core Web Vitals still center on LCP, INP, and CLS, with common “good” targets of under 2.5s, under 200 ms, and under 0.1.
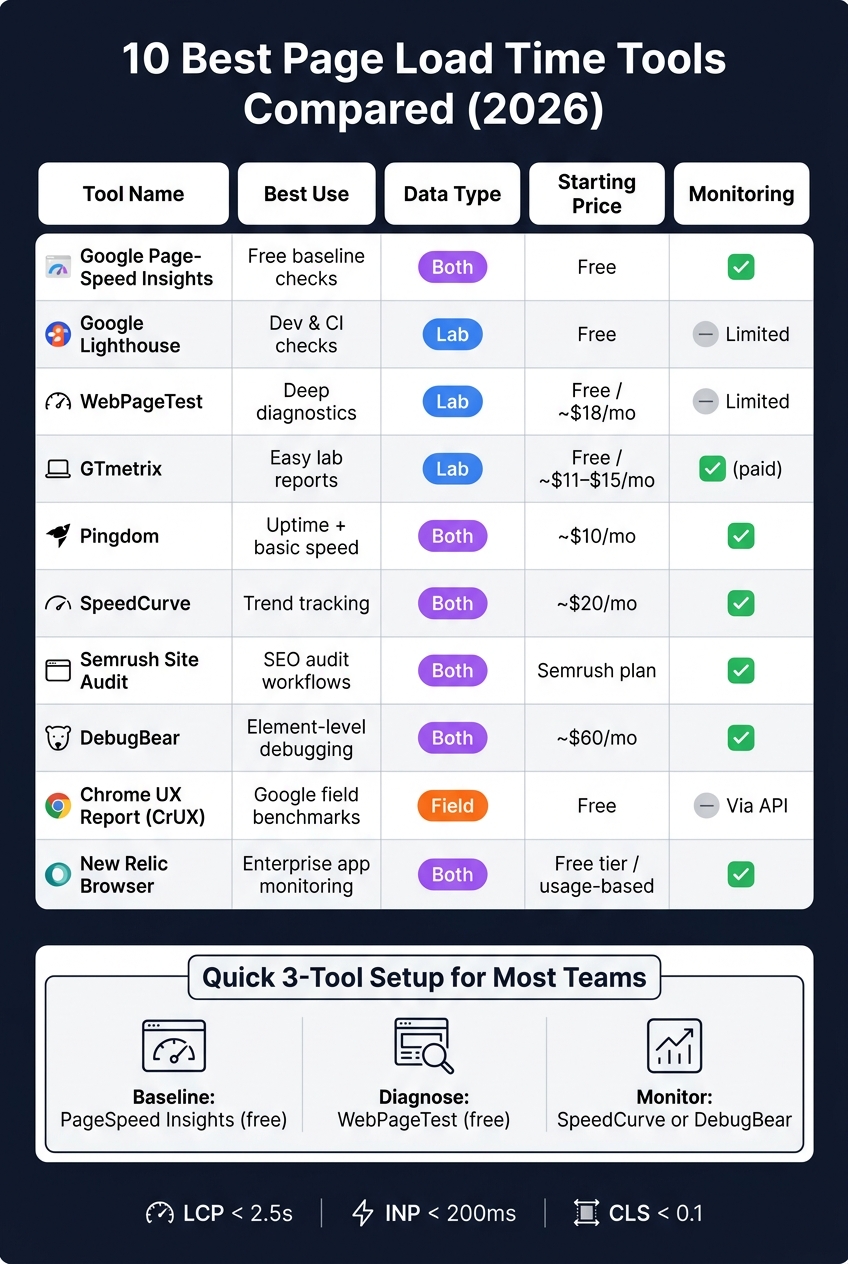
10 Best Page Load Time Tools Compared (2026)
How to check and improve page load time for your website
For a detailed analysis of your site's performance, you can use SEOptimer to identify specific technical issues.
sbb-itb-5be333f
Quick Comparison
| Tool | Best Use | Data Type | Price Starting Point | Monitoring |
|---|---|---|---|---|
| Google PageSpeed Insights | Free baseline checks | Lab + field | Free | No |
| Google Lighthouse | Dev and CI checks | Lab | Free | Limited via Lighthouse CI |
| WebPageTest | Deep diagnostics | Lab | Free / about $18/month | Limited |
| GTmetrix | Easy lab reports | Lab | Free / about $11-$15/month | Yes on paid |
| Pingdom | Uptime + basic speed | Lab + field | About $10/month | Yes |
| SpeedCurve | Trend tracking | Lab + field | About $20/month | Yes |
| Semrush Site Audit | SEO audit workflows | Lab + CrUX | Semrush plan | Yes |
| DebugBear | Page-level root cause checks | Lab + field | About $60/month | Yes |
| Chrome UX Report (CrUX) | Google field benchmarks | Field | Free | Via Search Console/API |
| New Relic Browser | Enterprise app monitoring | Lab + field | Free tier / usage-based | Yes |
My takeaway: use field data to see what users got, lab data to find what broke, and monitoring to catch drops after releases.
1. Google PageSpeed Insights
Google PageSpeed Insights (PSI) is a solid starting point for page speed checks. It uses Google's own data, so it's useful for Core Web Vitals and other diagnostics tied to search visibility.
Data Type
PSI shows two views: Lab Data and Field Data.
Lab Data comes from a simulated Lighthouse run. It's helpful for debugging because you can see how a page performs in a controlled test.
Field Data comes from CrUX and reflects the last 28 days of visits from actual users. For SEO, this is the view that matters most because it shows what people on your site are dealing with in practice. PSI only shows Field Data when your site has enough traffic to be included in the CrUX dataset.
Metrics
PSI focuses on Core Web Vitals:
- Largest Contentful Paint (LCP) for loading
- Interaction to Next Paint (INP) for responsiveness
- Cumulative Layout Shift (CLS) for visual stability
It also shows supporting metrics like First Contentful Paint (FCP), Time to First Byte (TTFB), and Total Blocking Time (TBT).
INP replaced First Input Delay (FID) as a Core Web Vital in March 2024, and it measures responsiveness across all user interactions on a page.
Good thresholds:
| Metric | Aspect Measured | "Good" Threshold |
|---|---|---|
| Largest Contentful Paint (LCP) | Loading performance | Under 2.5s |
| Interaction to Next Paint (INP) | Responsiveness | Under 200ms |
| Cumulative Layout Shift (CLS) | Visual stability | Under 0.1 |
| Time to First Byte (TTFB) | Server response time | Under 800ms |
Test Locations
PSI does not let you choose a test location. Lab Data runs on Google's infrastructure, and Field Data is grouped from users around the world.
Pricing
PSI is completely free. There are no locked features and no usage limits per property. It also includes a free API, which is handy if you want to automate reporting or send data into Looker Studio.
Monitoring
PSI is a point-in-time diagnostic tool. It does not include built-in alerts or history, so if you want trend reporting, you'll need to pull data through the API.
One practical tip: start with the mobile tab. That's usually where speed issues show up first.
Need deeper lab detail or control over where tests run? The next tool goes further.
2. Google Lighthouse
Where PageSpeed Insights adds field data, Lighthouse gives you a clean lab baseline. Google Lighthouse is the open-source engine behind Google PageSpeed Insights and GTmetrix. You can run it right inside Chrome DevTools, from the command line, or in a CI/CD pipeline with Lighthouse CI. It works best for repeatable lab tests, regression checks, and CI workflows.
Data Type
Lighthouse generates Lab Data only, which makes it a good fit for controlled, repeatable testing. If you want real-user data, use CrUX or PageSpeed Insights. In plain English, Lighthouse is strong for debugging and regression checks, but not for tracking user trends over time.
Run Lighthouse in an incognito window with extensions turned off. Your local setup can skew the results.
Once you have a baseline, the next step is knowing what Lighthouse measures.
Metrics
Lighthouse scores five areas: Performance, Accessibility, Best Practices, SEO, and PWA. Each category uses a 0-100 scale. If you're checking page load time, Performance is the one to watch most closely. These metrics are the main ones to compare across test runs.
| Metric | What It Measures | "Good" Threshold |
|---|---|---|
| Largest Contentful Paint (LCP) | Loading performance (main content) | Under 2.5s |
| Interaction to Next Paint (INP) | Responsiveness to user interactions | Under 200ms |
| Cumulative Layout Shift (CLS) | Visual stability | Under 0.1 |
| First Contentful Paint (FCP) | First content rendered | Under 1.8s |
| Time to First Byte (TTFB) | Server response time | Under 600ms |
Test Locations
Lighthouse does not support multiple test locations out of the box. In Chrome DevTools, it runs on your local machine, so results can change based on your device, browser state, and network. It supports both mobile and desktop simulations, but it does not give you the global location coverage you get from tools like WebPageTest.
Pricing
Lighthouse is completely free and open-source.
Monitoring
Lighthouse is a snapshot tool, so it does not come with built-in historical tracking, alerts, or dashboards. For regular monitoring, Lighthouse CI can fail builds when a performance budget slips. That's handy for checking template updates, catching regressions early, and giving developers a simple way to review performance checks.
For location-specific testing and deeper waterfalls, WebPageTest is next.
3. WebPageTest
WebPageTest is a synthetic lab tool built for deep performance debugging. It runs tests in real browsers from dozens of locations around the world. So if Lighthouse gives you the first read, WebPageTest is often the next stop when you need to find the actual cause of a slowdown.
Data Type
WebPageTest is a synthetic lab tool. It runs real browsers and lets you throttle the connection to 3G, 4G, or cable speeds. That makes it useful when you want to see how a page holds up under mobile conditions that feel closer to what users may face.
Metrics
WebPageTest measures Core Web Vitals, including LCP, INP, and CLS, along with FCP, Speed Index, TBT, and TTFB. It also gives you waterfall, filmstrip, and video views, so you can inspect request timing and rendering frame by frame.
One feature that stands out is Opportunities and Experiments. It lets you test a change before you ship it. That’s handy when you want to check whether a fix will help before your team touches production.
Test Locations
WebPageTest offers dozens of global test locations. You can also pick the browser, device type, and connection speed for each run, which gives SEO teams much more control over test conditions using SEO marketing tools. That extra control matters. A page might look fine from one region on fast Wi-Fi, then struggle on mobile from another market. WebPageTest helps you see that difference.
It also has an edge over free tiers that lock you into one location.
Pricing
The free tier covers individual diagnostic runs with full waterfall and filmstrip views. Paid plans start at about $18/month and add heavier usage, API access, and scheduled testing. Enterprise pricing is available through Catchpoint for high-volume synthetic monitoring.
Monitoring
WebPageTest is strongest as a diagnostic tool, not as an always-on monitoring setup. It does not offer native real-time alerting in the same way dedicated monitoring tools do. It does support multi-step scripting for more complex user flows.
For teams that need deep debugging, that’s often enough. But if you want routine tracking and alerts, other tools fit that job better.
4. GTmetrix
GTmetrix gives you deep page-speed diagnostics without making the reports hard to use. For SEO teams and in-house marketers, it lands in a useful middle ground - more detailed than a quick lab check, but not as heavy as a full monitoring platform.
Data Type
GTmetrix is a lab tool built on Lighthouse and WebPageTest. It works well for diagnosing issues in a controlled test. Then, to sanity-check what users see in the wild, compare LCP and CLS against field data from Search Console or CrUX.
Metrics
GTmetrix tracks LCP, TBT, and CLS. It also shows a Performance Grade and Structure Score. The Hints section helps you spot likely fixes fast, and the waterfall and filmstrip views make it easier to see what loads when and where the page starts to drag.
Test Locations
The free tier usually lets you test from one location. Paid plans open up dozens of global locations and mobile simulation.
Pricing
Paid plans start at about $11-$15 per month. Those plans add more test locations, mobile testing, scheduled monitoring, and PDF reports.
Monitoring
GTmetrix supports scheduled testing and alerts on paid plans. It also keeps historical data, which helps when you're trying to connect a speed drop to a site change or release. If you need always-on monitoring, the next tools go deeper.
5. Pingdom
Pingdom fills a different spot than the other tools in this list. It puts uptime first and speed second. That makes it a solid fit for site owners and in-house marketers who want one dashboard for both jobs. Its main strength is continuous monitoring, not deep troubleshooting. It works best for teams that need uptime alerts, simple performance checks, and light reporting.
Data Type
Pingdom combines synthetic lab testing with Real User Monitoring (RUM). It runs scheduled tests from fixed locations and pairs that data with RUM. Use it when you want both scheduled checks and data from actual visitors.
Metrics
Its reports show a Performance Grade (A-F), total load time, page size, and request count. You also get a content breakdown by file type and domain.
Pingdom includes a basic waterfall and 500 ms page-load snapshots. That said, it does not center its main reports around Core Web Vitals like LCP, INP, or CLS. So if your team is tracking Core Web Vitals as a main KPI, you’ll want a second tool alongside it. In that case, Pingdom is more useful for monitoring than for finding root causes.
Test Locations
You can run tests from multiple regions, including San Jose, CA, and locations across Europe. That helps when you’re trying to check whether a slowdown is tied to one region instead of the whole site.
Pricing
A free website speed test is available for one-off checks. Paid monitoring plans start at about $10/month.
Monitoring
This is where Pingdom stands out. It runs continuous uptime checks plus speed monitoring and sends alerts when a site goes down or falls below a set threshold.
Pingdom is best for uptime alerts and simple speed checks. For deeper Core Web Vitals analysis, use PageSpeed Insights or WebPageTest.
If you need more advanced performance tracking and reporting, the next tool goes deeper.
6. SpeedCurve
SpeedCurve is less about one-time tests and more about tracking performance over time. If you want to see how speed changes after releases - and whether those changes affect traffic or conversions - this tool is built for that job.
Data Type
SpeedCurve combines lab testing with RUM to give you both benchmark data and field data. The main focus is long-term trend tracking and ROI, not isolated test runs.
Metrics
It tracks Core Web Vitals over time and uses page-element analysis to show which scripts or page elements are dragging those metrics down. It also supports competitor benchmarking, so you can compare site speed side by side.
That extra depth comes with a higher price tag.
Pricing
Plans start at about $20/month. If you need advanced RUM or CI/CD use cases, pricing usually falls in the $100-$500/month range.
Monitoring
You can set performance budgets and get alerts when regressions happen. SpeedCurve also keeps long-term trend data tied to releases, which makes it easier for SEO teams and in-house marketers to see whether a deployment helped or hurt scores - and link those changes back to ROI.
Next is a broader SEO audit tool that includes PageSpeed checks inside site health reporting.
7. Semrush Site Audit
Semrush Site Audit is a technical SEO audit tool with page-speed checks built in. It works best for teams that want performance data inside a broader site-health workflow. Use it when speed checks matter, but you also need technical SEO audit.
Data Type
It relies on cloud crawls and scheduled audits for synthetic testing, pulls field data through Google Analytics, and uses CrUX for mobile and desktop Core Web Vitals.
Metrics
Semrush shows a Health Score, 140+ technical checks, and prioritized fixes for Core Web Vitals, HTTPS, internal links, hreflang, and errors. That setup helps teams focus on the biggest technical problems first instead of getting buried in a long audit report.
Pricing
Semrush Site Audit comes bundled with the broader Semrush suite, so pricing depends on the plan. There’s a 7-day free trial. Free crawls cover 100 pages, while paid plans scale from 100,000 to 1,000,000 pages.
Monitoring
Scheduled crawls and audit-result comparisons help teams spot regressions after deployments. If you need element-level debugging, use WebPageTest or DebugBear. For deeper page-level debugging, the next tool goes further.
8. DebugBear
When a site audit flags a slow page, DebugBear helps you find the exact cause. It’s built for diagnosis - not just spotting that performance got worse, but showing which element, script, or layout shift is dragging the page down.
Data Type
DebugBear combines scheduled lab tests with RUM, so you can line up controlled test runs with what actual users see.
Metrics
It tracks LCP, CLS, INP, TTFB, waterfalls, and long tasks. What stands out is its element-level attribution for LCP and layout shifts.
Element-level LCP attribution shows which image or text block is slowing down the page. Layout-shift attribution points to the elements that are making the page jump around.
Test Locations
DebugBear supports testing from multiple global locations. That makes it easier to compare TTFB and server latency across regions.
Pricing
Plans start at approximately $60/month.
Monitoring
DebugBear runs scheduled tests, sends alerts when metrics cross your thresholds, and stores history so you can connect regressions to releases or script changes.
9. Chrome UX Report (CrUX)
If you want the broadest view of real user experience, CrUX shows what Google sees from Chrome traffic. It’s Google’s source of field data for page experience, based on 28 days of aggregated Chrome data from opt-in users. So instead of showing what might happen in a lab test, it shows what people actually ran into on real devices, networks, and connections.
Data Type
CrUX is field data. That means it reflects performance across real phones, desktops, network speeds, and locations - not a controlled synthetic test.
Metrics
CrUX tracks Google’s Core Web Vitals: Largest Contentful Paint (LCP), Interaction to Next Paint (INP), and Cumulative Layout Shift (CLS).
Google’s current “good” thresholds are below:
| Metric | Good Threshold |
|---|---|
| Largest Contentful Paint (LCP) | Under 2.5s |
| Interaction to Next Paint (INP) | Under 200ms |
| Cumulative Layout Shift (CLS) | Under 0.1 |
| Time to First Byte (TTFB) | Under 800ms |
That’s why CrUX is best for benchmarking and trend-checking, not for pinpointing the exact cause of a problem. It tells you what users felt, but not always why they felt it.
Test Locations
CrUX doesn’t use fixed test locations. It reflects real users across the globe.
Pricing
CrUX is free through Google PageSpeed Insights, Google Search Console, and the CrUX API. Some third-party platforms put that data into dashboards and charge for the reporting layer, but the source data itself is free.
Monitoring
For ongoing tracking, use Google Search Console’s Core Web Vitals report. It breaks data out by mobile and desktop. On low-traffic pages, it may use origin-level data instead of URL-level data, which means the numbers can represent the full domain rather than one specific page.
10. New Relic Browser
New Relic Browser is an enterprise observability tool that combines RUM and synthetic tests. It’s best for teams that want page-load data connected to app and server health.
Data Type
New Relic Browser uses both real user monitoring (RUM) and synthetic monitoring.
Metrics
It tracks LCP, INP, CLS, front-end traces, and JavaScript errors. Unlike dedicated speed tools, New Relic also connects front-end performance with backend server health and infrastructure monitoring.
Test Locations
Synthetic tests run from multiple global locations under different network conditions.
Pricing
New Relic offers a free tier and uses a usage-based pricing model.
Monitoring
You can set threshold-based alerts for performance regressions and real-time changes. New Relic makes the most sense when page-load monitoring needs to live next to app and infrastructure alerts. That makes it a better fit for always-on monitoring than one-off diagnostics.
For teams choosing between lab checks, field data, and ongoing monitoring, the next section breaks down the differences.
How These Tools Differ
Page load tools do different kinds of work. The easiest way to compare them is across four areas: data source, metric depth, test setup, and whether they watch performance over time.
Lab Data vs. Field Data
Lab data comes from a controlled test. Field data comes from real users over time.
For SEO, field data matters more because it shows actual user experience and Core Web Vitals in the wild. PSI, SpeedCurve, and DebugBear combine lab and field data. Lighthouse, WebPageTest, and GTmetrix are mostly lab tools.
That split matters. Lab tools are usually better for debugging. Field data is better for checking what users are experiencing.
Metrics Depth: Core Web Vitals, Waterfalls, and Visual Rendering
Most tools show Core Web Vitals - LCP, INP, and CLS - but they don't all go equally deep.
WebPageTest and GTmetrix stand out for waterfall charts and filmstrip views. DebugBear goes further with element-level attribution, which helps you spot what part of the page is dragging performance down. PSI and Semrush stay at a higher level, which is fine for a quick read but less useful when you need to dig in to top SEO tools and services.
Next comes test setup. This is where quick-check tools start to split from tools built for deeper diagnosis.
Test Locations and Device Options
Location choice is a big divider between monitoring-grade tools and simple checkers. WebPageTest and Pingdom offer broad global test coverage. GTmetrix limits locations on its free plan. PSI doesn't let you pick a location in its standard interface.
Device setup matters too. Mobile testing often reveals problems desktop runs gloss over, since slower phones and weaker networks put more stress on a page. DebugBear and SpeedCurve let you set mobile profiles with connection throttling for a more realistic test setup.
Then there's the next split: one-off testing versus watching performance all the time.
Monitoring, Alerts, and Reporting
Some tools are built for single audits. Others are built to track performance day after day.
PSI and Lighthouse are manual-run tools. SpeedCurve, DebugBear, and Pingdom are set up for continuous tracking. Platforms like SpeedCurve and DebugBear can send Slack or email alerts when performance budgets are breached or regressions show up.
| Tool | Data Type | Waterfall Charts & Filmstrip | Test Locations | Continuous Monitoring |
|---|---|---|---|---|
| Google PageSpeed Insights | Lab + field | - | Limited | No |
| Google Lighthouse | Lab | - | N/A | No |
| WebPageTest | Lab | Yes | Extensive | - |
| GTmetrix | Lab | Yes | Limited on free tier | Yes on paid plans |
| Pingdom | Lab + field | - | Extensive | Yes |
| SpeedCurve | Lab + field | - | Extensive | Yes |
| Semrush Site Audit | Lab + CrUX field data | - | - | - |
| DebugBear | Lab + field | Yes | Extensive | Yes |
| Chrome UX Report (CrUX) | Field only | - | N/A | No |
| New Relic Browser | Lab + field | - | Extensive | Yes |
Use these differences to choose the right tool in the pros and cons below.
Pros and Cons of Each Tool
Each tool has a clear sweet spot. Use this summary to match the tool to the job: quick checks, deep diagnostics, ongoing monitoring, or SEO reporting.
| Tool | Main Pros | Main Cons | Best Fit |
|---|---|---|---|
| Google PageSpeed Insights | Free; combines lab + field data; direct Google ranking alignment | No waterfall charts; no historical tracking; one page at a time | SEOs and site owners |
| Google Lighthouse | Free; scriptable for CI/CD pipelines; broad audit scope (SEO, accessibility, performance) | Lab data only; scores can vary between runs | Developers during the build phase |
| WebPageTest | Deepest free diagnostics; real device testing; Experiments mode to test fixes before deploying | Steep learning curve | Performance engineers |
| GTmetrix | Clean letter-grade summaries; excellent waterfall charts; historical tracking | Best locations and features locked behind paid plans; free tier is rate-limited | Agencies and marketers |
| Pingdom | Simple interface; global test locations; combined uptime and speed monitoring | Lacks Core Web Vitals focus; limited diagnostic depth | Small businesses needing uptime alerts |
| SpeedCurve | Continuous monitoring; performance budgets; correlates speed with business metrics | Higher cost; steeper learning curve for new users | Product and engineering teams |
| Semrush Site Audit | Scheduled crawls; 140+ technical checks; ties findings to SEO performance | Requires a paid Semrush subscription for full value | In-house SEO teams |
| DebugBear | Element-level attribution for LCP and CLS; scheduled lab tests plus RUM | Higher price point; technical interface | E-commerce and SaaS engineering teams |
| Chrome UX Report (CrUX) | Google's primary field-data source for Core Web Vitals reporting; free via API or BigQuery | No diagnostic data; only available for sites with sufficient traffic | SEOs validating field performance |
| New Relic Browser | Full-stack observability; handles complex, large-scale applications | High cost; complex setup; overkill for smaller sites | Enterprise engineering teams |
Three tools need a bit more context.
For SEO teams, Google PageSpeed Insights is usually the fastest place to start. You get Google's CrUX field data and a lab snapshot in one view. That matters because CrUX is the same source used in Core Web Vitals reporting.
WebPageTest goes much deeper. If your team wants to test fixes before pushing them live, this is often the best option. Its diagnostic detail is hard to beat, but it does take more time to learn.
Semrush Site Audit makes the most sense when page speed is just one part of a bigger SEO process. It works best when speed checks sit alongside broader technical SEO audits, not as a stand-alone performance tool.
SpeedCurve and DebugBear are a better fit for teams that need ongoing monitoring and regression alerts. If you're trying to catch performance slips before they turn into a bigger mess, those are the tools to look at.
Conclusion
The right tool comes down to the question you need to answer. Here’s the quick match guide:
| Audience | Best Tool | Why |
|---|---|---|
| Free quick checks | Google PageSpeed Insights | Free, lab + field baseline |
| Deep lab diagnostics | WebPageTest | Deep lab diagnostics |
| Synthetic monitoring | SpeedCurve | Continuous monitoring |
| Hybrid lab + field | DebugBear | Lab + RUM with attribution |
| In-house SEO teams | Semrush Site Audit | SEO audit workflow |
| Enterprise RUM | New Relic Browser | Enterprise RUM |
For most SEO teams, the best setup is simple: one baseline tool, one diagnostic tool, and one monitoring tool.
Pick based on data type first. Use field data for what users are actually seeing, lab data for debugging, and monitoring to catch regressions before they become a bigger problem.
If you’re doing agency or tool research, Top SEO Marketing Directory is a useful next stop.
A practical place to start: use PageSpeed Insights for the baseline, WebPageTest to diagnose issues, and SpeedCurve or DebugBear for ongoing monitoring.
FAQs
Which tool should I start with?
For most users, Google PageSpeed Insights is the best place to start. It gives you both lab data and field data, so you can see controlled test results alongside what actual users experience. It also shows Core Web Vitals, which makes it a strong first check for SEO performance.
That said, one tool rarely tells the whole story. A more balanced approach is to use at least two tools. Start with Google PageSpeed Insights, then use GTmetrix or WebPageTest when you need deeper waterfall analysis to diagnose specific load-time bottlenecks.
Do I need both lab and field data?
Yes. Field data shows how people experience your site on actual devices, networks, and in different places. It’s also the main input for Google’s ranking signals.
Lab data gives you a controlled setup for debugging, spotting bottlenecks, and testing fixes. Use both, and you get a clearer view of what’s happening - plus a better sense of what to fix first.
What matters more: testing or monitoring?
Both matter because they do different jobs.
Testing gives you snapshots. It helps with debugging, checking fixes, and seeing how something behaves in a controlled lab setup.
Monitoring does a different job. It tracks performance over time, which helps you spot regressions, script delays, or infrastructure issues before users feel the impact.
The best setup is to use both:
- Synthetic testing for controlled checks
- Real-user monitoring for what people experience on actual devices and networks